Research
April 14, 2016
Assumptions Revisited: The 2012-2016 CAFE Standards
Executive Summary
- Corporate Average Fuel Economy (CAFE) standards are regulations that mandate the minimum gas mileage of a typical vehicle. In recent years, the administration has aggressively updated them as a means towards reducing carbon pollution.
- The cost-benefit analyses of this regulation are always based on future projections. This paper sets out to determine how precise these projections are in hindsight.
- When the EPA and the National Highway Transit Safety Administration (NHTSA) made projections for fuel efficiency standards from 2012-2016, they did not expect the recent decline in oil prices.
- This decline causes dramatically different price and consumption projections than those in the agencies’ analysis.
- In reality, lower fuel prices – not reduced consumption – drive greater consumer savings today. This undermines one of the building blocks of the rule’s benefits.
- The current projections, which include recent and more stringent regulations in their analysis, also find that EPA and NHTSA likely overestimate the consumption reductions from the model year (MY) 2012-2016 rule. This could affect the emission reduction portion of their cost-benefit analysis.
Corporate Average Fuel Efficiency (CAFE) Standards, promulgated jointly by the Environmental Protection Agency (EPA) and NHTSA, have been among the most expensive and consequential rulemakings in recent history. For instance, the 2012 regulation setting CAFE standards for 2017 and beyond imposes the highest lifetime cost of any rule during the Obama Administration: $156 billion. The earlier version promulgated in 2010, setting standards for Model Years (MY) 2012-2016, clocks in at nearly $52 billion. For rules of this magnitude, it is important to review the agencies’ original analysis in order to better understand their interaction with what actually happens. In the case of the 2010 rule, there is considerable conflict between recent data and agency projections.
There is a burgeoning interest in the real-life effects of the CAFE standards. This is due in large part to the rapid, somewhat unexpected decline of oil prices. Recent articles from the New York Times and Vox examine research suggesting cheaper oil prices may limit the pace with which manufacturers increase “miles per gallon” (MPG) and how that may affect consumer behavior. This paper seeks to examine another aspect of the agencies’ analysis: the impact on fuel savings, both in gallons consumed and dollars spent. An analysis of recent Energy Information Administration (EIA) data suggests that: 1) the projections of 2012-2016 market behavior do not align with reality and 2) the projections for 2017 and beyond may also have serious flaws.
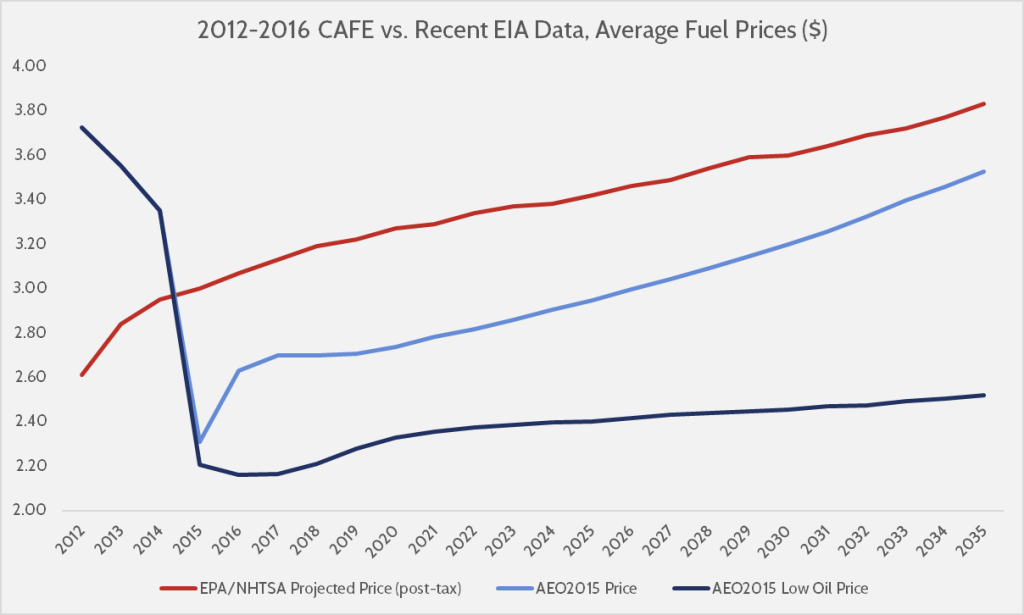
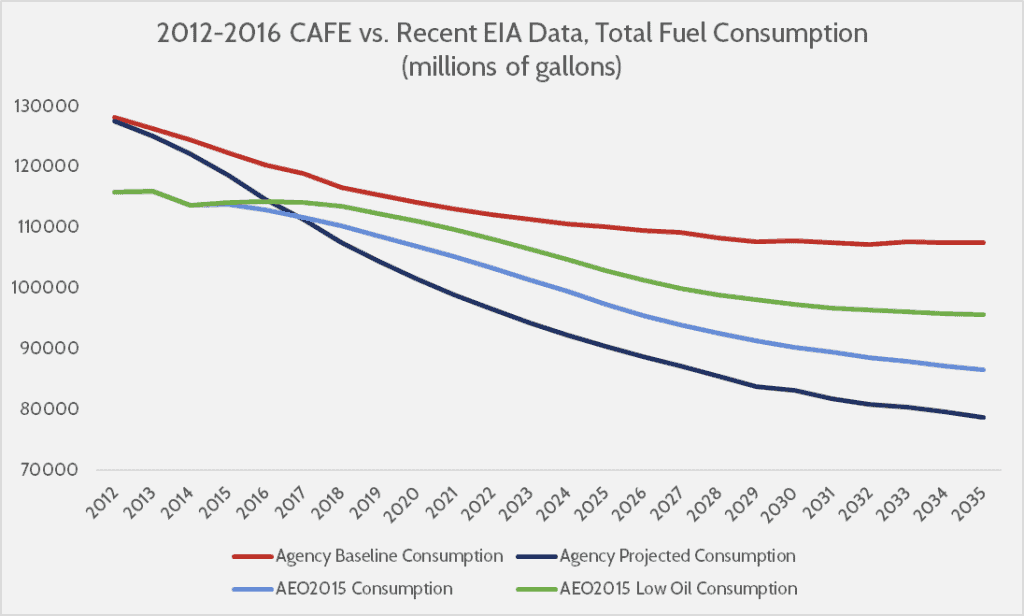
One of the primary factors in EPA and NHTSA’s regulatory benefits calculations is the savings consumers will experience over time due to consuming less fuel in their more efficient vehicles. The agencies estimated that over the rule’s lifetime it could save consumers between $112 and $143 billion (depending the on discount rate).[1] That section of the analysis derives its underlying data from EIA’s 2010 Annual Energy Outlook (AEO). Using the more recent 2015 AEO, we can compare real data on most of the covered years (2012-2014) as well as projections going forward with those from the RIA. The graphs below illustrate the differences in price and consumption projections.
Table 1: Fuel Price Comparison
Table 2: Fuel Consumption Comparison
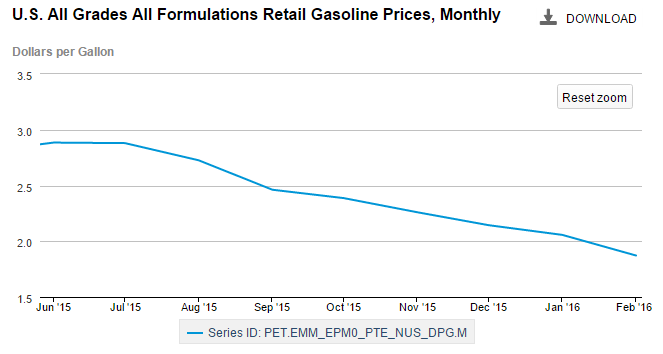
Table 1 compares the agencies’ projected price of a gallon of fuel with estimates from the 2015 AEO (reference case and “Low Oil Price”, respectively). As the graph demonstrates, the agencies underestimated the price of fuel in the earliest years of the covered period and overestimate it in the out-years. The graph also incorporates recent “Low Oil Price” projections as an illustration of the potential implications of the recent downwards trend in fuel prices due to lower crude oil prices. While it is difficult to say with certainty whether or not current oil prices will stay at a level that justifies the “Low Oil Price” level, it is entirely plausible as EIA tracking data finds a period of uninterrupted decline in fuel prices since last June:
Table 2 illustrates the differing assumptions about how much fuel the nation’s drivers will consume in a year. Although all the projections assume a downward trend, the agencies actually overestimated the consumption level in recent years. The most curious aspect of this data is that, from 2017 onwards, the agencies project lower consumption than the most recent AEO. This is notable because as EIA confirms:
“In all the AEO2015 cases, U.S. laws and regulations shape demand and, consequently, the price of petroleum products in the United States. The Corporate Average Fuel Economy (CAFE) standards for new light-duty vehicles (LDVs), which typically use gasoline, rise from 30 miles per gallon (mpg) in 2013 to 54 mpg in 2040 under the fleet composition assumptions used in the final rule issued by the U.S. Environmental Protection Agency (EPA) and National Highway Transportation Safety Administration.”
The AEO 2015 projections include the 2012 rule setting standards for 2017 and beyond in its calculations. That round of CAFE standards is presumably more stringent than the one examined here, and should project lower consumption levels going forward. As such, since the AEO 2015 levels are still higher than those projected in the RIA, it suggests that the agencies drastically overestimate the decrease gallons consumed caused by this rule. What does this mean for monetized fuel savings estimates? It depends on which assumptions you consider.
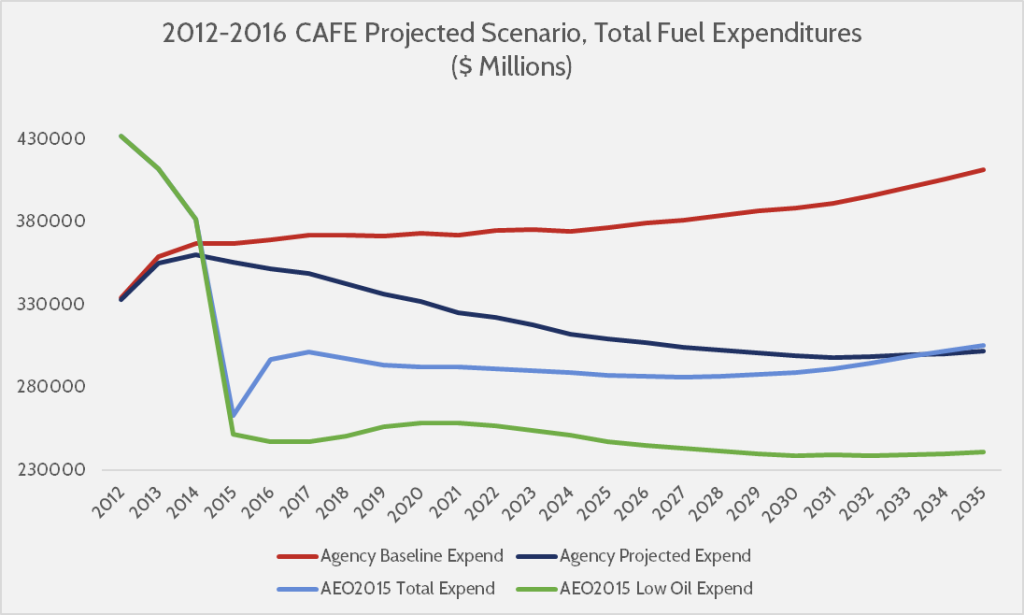
Table 3: Fuel Expenditure Comparison
Table 3 illustrates the differing assumptions of: the agencies’ baseline (no-rule) expenditure level, the agencies’ projected fuel expenditure level under the rule, the 2015 AEO “Reference Case” level, and the 2015 AEO “Low Oil Price” level. According to this, the amount consumers spent on fuel over the recent past is more than what the agencies projected. Yet, due to the dramatically lower fuel price projections found in recent data, consumers will see significant savings in coming years.
In fact, a continued level of low oil prices yields the greatest savings by quite a margin. For instance, in 2016, the “Low Oil Price” level yields savings of more than $122 billion from the rule’s baseline. That one-year figure exceeds the rule’s lower-end estimate for overall fuel savings of $112 billion. Since this gap is largely price-driven rather than consumption-driven, it may have diminished impacts on the emissions side, but is still likely welcome news for the average driver.
There are some issues that may complicate this dynamic. First, incorporating the 2012 rule’s more substantial consumption reductions could very well bend the “Agency Projected” levels towards the “AEO2015” levels more rapidly. However, as noted above, the recent AEO data incorporates that issue in its projection. Thus, while it may narrow the gap between EIA’s data and agency projections, there would still likely be some disparity.
Second, the different price and consumption assumptions may lead to changes in the rebound effect, wherein more efficient vehicles induce greater consumer usage, thus mitigating some of the consumption efficiency. The rule uses a rebound effect of 10 percent. EIA does not fully examine the rebound effect, but does note that: “lower gasoline prices stimulate enough increased VMT [vehicle miles traveled] to offset a part of the impact of fuel efficiency improvements resulting from regulation.” While not perfectly analogous, these both represent demand-side effects that diminish possible consumption reductions. How they affect the overall dynamic between the two projections is difficult to discern with available data.
These caveats likely complicate the picture from 2017 onward, but in terms of what the agencies projected in the 2010, it seems they were still far off. Granted, regulators are not psychic, and the sudden drop in oil prices was likely an unforeseen event. But it is clear that they incorrectly projected a decrease in consumption and increase in prices going forward. Consumers may still see savings relative to the expected 2010 baseline, but they could be largely from diminished gas prices—not from the impact of the CAFE regulations.
This is why retrospective review of regulations matters. Regulators use projections to demonstrate how the costs of a rule can be justified by the benefits. Looking back, however, these projections aren’t borne out in reality. In the case of this rule, the agency’s original assumptions don’t add up, and this directly impacts the benefits associated with this massive rule. Naturally, this argues for a regular examination of regulations in hindsight, to determine whether their cost-benefit projections live up to reality.
[1] The agencies’ joint Regulatory Impact Analysis (RIA) provides a more extensive, annual breakdown of this data (Table 6-16).


