Weekly Checkup
June 16, 2023
Un-QALY-fied
With the recent markup of H.R. 485, the Protecting Health Care for All Patients Act of 2023, quality-adjusted life years (QALYs) are back in the policy spotlight. The bill would ban the use of QALYs and related measures in all federal and state health programs. Let’s explore what QALYs are, how they are used in the U.S. health care system, and their pros and cons.
In simple terms, the QALY measurement is a numerical score on the value of a treatment by looking at its length-of-life and quality-of-life benefits. QALYs are generally calculated by surveying patients in various health states about their perceived quality of life, how much time is spent in those health states, and then multiplying the two. Essentially, the QALY measurement weights the year of life by its perceived quality. For example, if a cancer drug extends a patient’s life but has severe side-effects that makes those additional years physically painful, that drug may earn a lower QALY score.
QALY scores can also be (and are) used when measuring a treatment’s benefits to provide a better understanding of its cost-effectiveness, and this is where the controversy begins. On the surface, QALYs represent one tool that can help payers determine whether a treatment is “worth” the expense. When an insurer compares two similarly priced drugs for the same condition, the drug with the higher QALY score would appear to be a better option to include on a formulary. Similarly, a pharmaceutical company can use QALYs to determine if a drug it’s developing is better or worse than competitors’ drugs and therefore worth continued investment. This is even more relevant as the federal government begins its price-setting “negotiations” under the Inflation Reduction Act (IRA) later this year. While QALYs are explicitly banned in the IRA, there are other measures very similar to QALYs that attempt to do the same thing: measure whether the additional years of life added on are “worth it” to the federal government.
We have an example of a country that uses QALYs to determine drug coverage. The United Kingdom’s National Health Service (NHS) uses QALYs as a determining factor in choosing drugs to cover – and usually, coverage is granted if that drug costs between £20,000 and £30,000 per QALY. Some drugs get excluded from the list, of course, even if they are proven to extend the years of life and the quality of those years. Even for the NHS, the QALY standard has proved problematic enough that the Innovative Medicines Fund was created to pay for drugs that treat severe conditions but proved too expensive per QALY. This highlights one issue with using QALYs and similar measures: They disincentivize new drugs for complex conditions. The first drugs created for severe conditions are rarely as effective as later versions, but they provide important starting points for treatment and fund continued research to improve the drug.
The great problem with QALYs, and similar adjustments, is that they take an intensely personal decision – how much our time on this planet is worth – and boil it down to a fairly basic math equation. For the elderly (who have fewer years to live) or the disabled (whose quality of life is not easily measured from a health standpoint), there are genuine fears that QALYs could effectively discriminate against treatments that could benefit these populations. In short, while QALYs may provide useful information, it seems unwise to tie them directly to reimbursements.
Chart Review: Food Insecurity During COVID-19
Adi Sridharan, Health Care Policy Intern
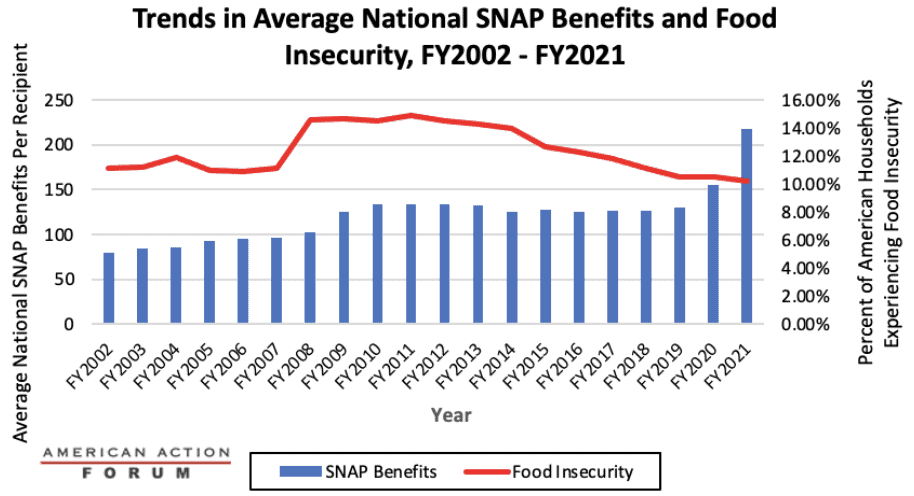
The U.S. food insecurity rate is at its lowest level in nearly 20 years despite substantial food-price inflation, the economic damage caused by the COVID-19 pandemic, and its attendant policy responses. Even with the COVID-19 pandemic and related shutdowns pushing the national unemployment rate to 13 percent in 2020, food insecurity rates over the last three years never approached those witnessed during the Great Recession. According to the latest data from the U.S. Department of Agriculture (USDA), the percentage of Americans who experienced food insecurity remained around 10 percent between 2020–2021. This trend contradicts typical food insecurity patterns during recessionary periods. As shown in the chart below, Americans experiencing food insecurity increased from 11.1–14.7 percent between 2007–2009, the height of the Great Recession. Of course, the recovery from COVID-related economic distress was much quicker, and increased welfare spending–Supplemental Nutritional Assistance Program (SNAP), extended Universal Income, Paycheck Protection Program loans, etc–connected to the public health emergency may have helped prevent a rise in food security rates. The chart below focuses exclusively on SNAP benefits and food insecurity. The Families First Coronavirus Response Act (FFCRA), passed in March of 2020, allowed states to ease eligibility requirements for the program so families with children who qualified for free or reduced-price lunch could receive meal replacement benefits. The FFCRA also granted emergency allotments of $95, or an additional benefit valued up to the maximum benefit of a recipient’s household size, whichever was greater. As a result, average benefits rose to $230.11 per individual by 2022 from $129.83 per individual in 2019.