Housing Chart Book
April 5, 2019
Demand and House Prices
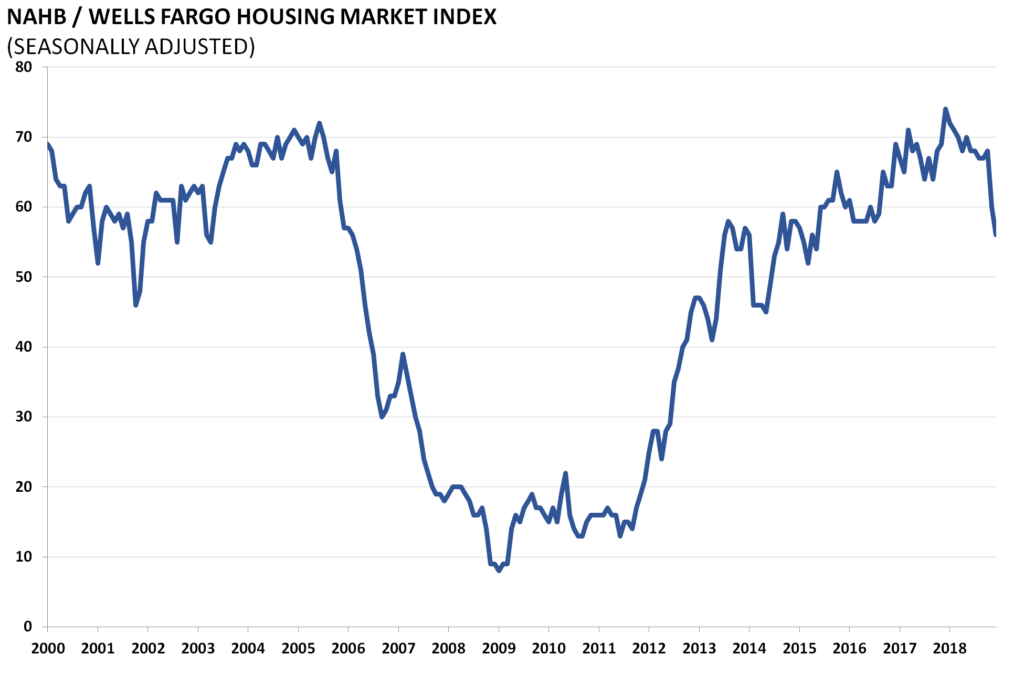
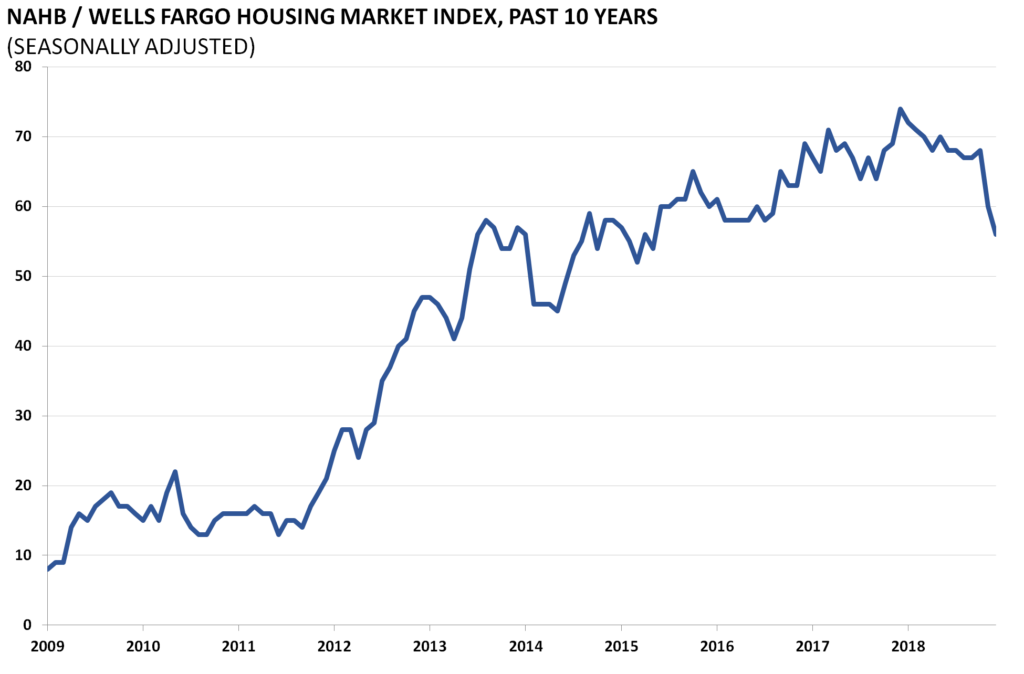
The National Association of Home Builders (NAHB) releases its Housing Market Index monthly to record builder sentiment on the demand side of the single-family housing market. The index is frequently used in assessments of housing market conditions. It is derived from a survey of builders who rate the market based on sales and expectations.
Source and Data Release: https://www.nahb.org/en/research/housing-economics/housing-indexes/housing-market-index.aspx
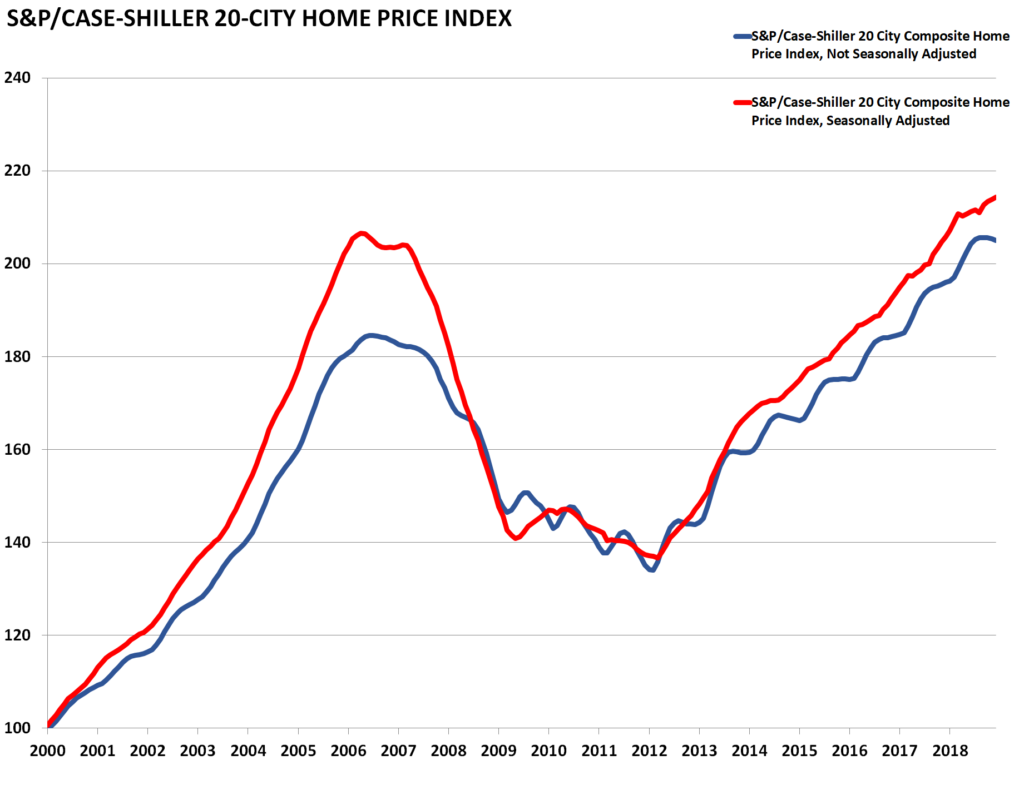
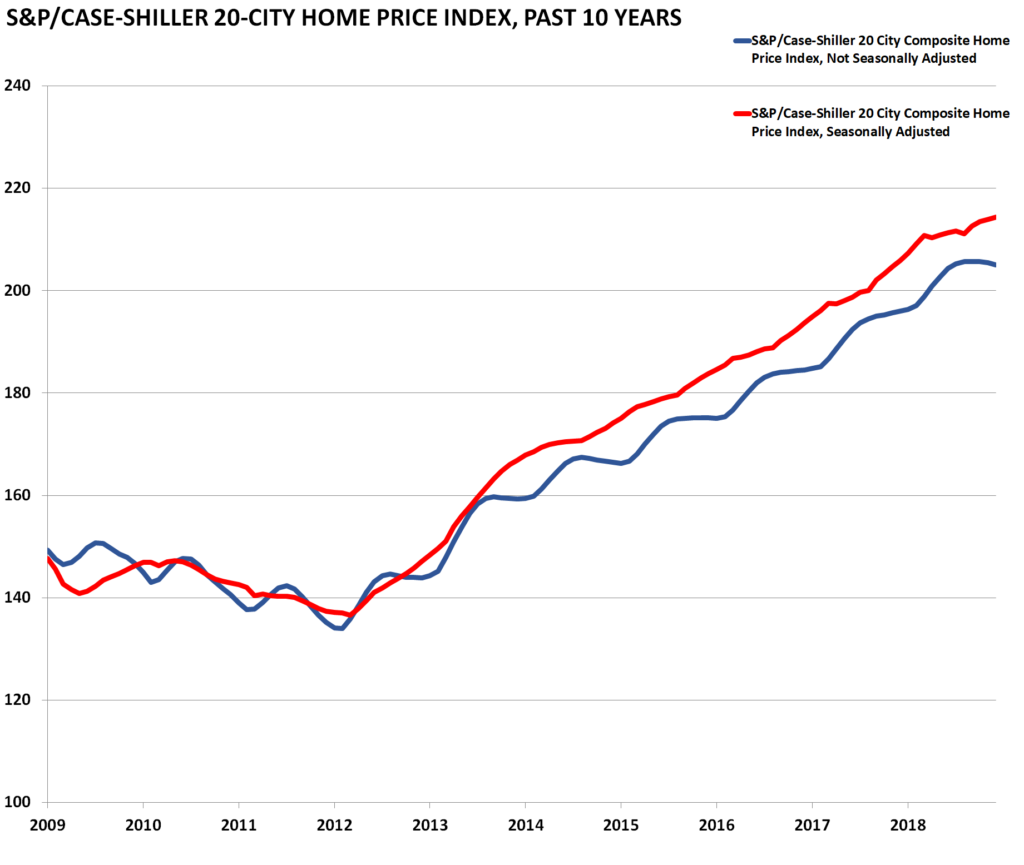
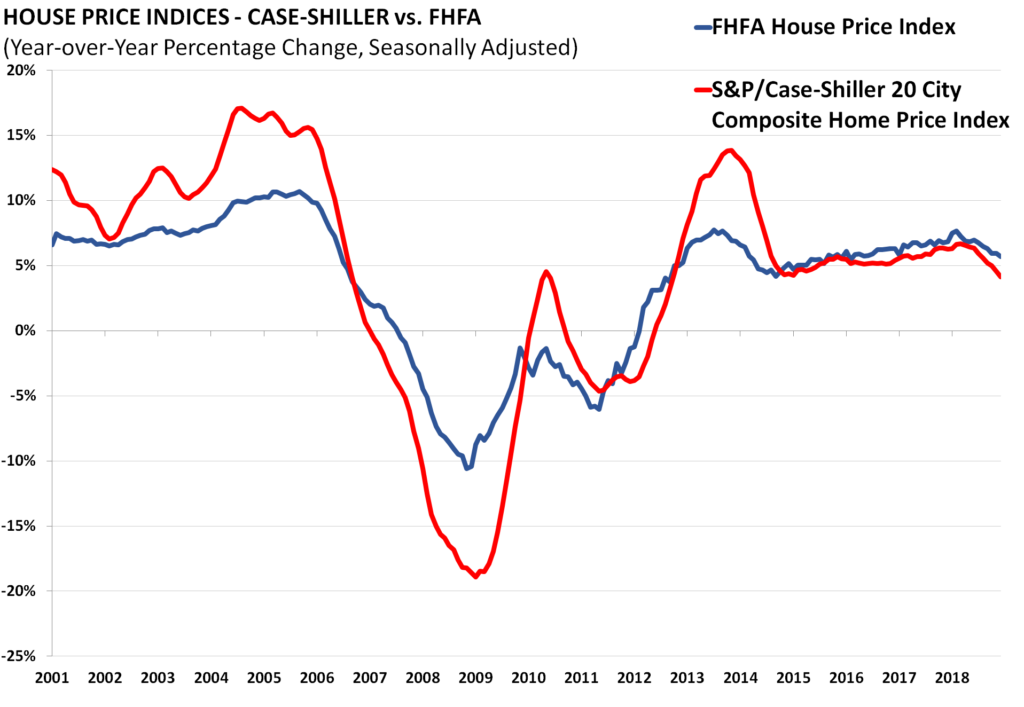
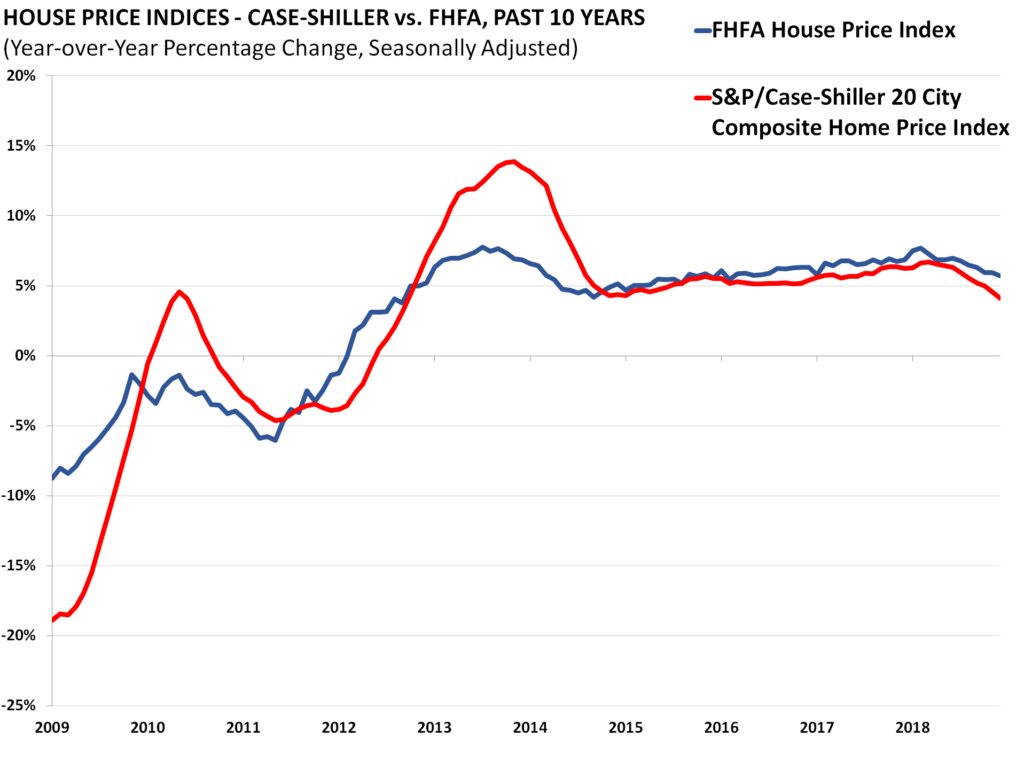
The S&P/Case-Shiller home price index is released near the end of each month for the month two months previously. The release is an index of home prices in 20 of the largest metropolitan areas across the country. It is a reputable and widely reported indicator of home prices.
Source: https://www.fhfa.gov/DataTools/Downloads/Pages/House-Price-Index-Datasets.aspx#mpo
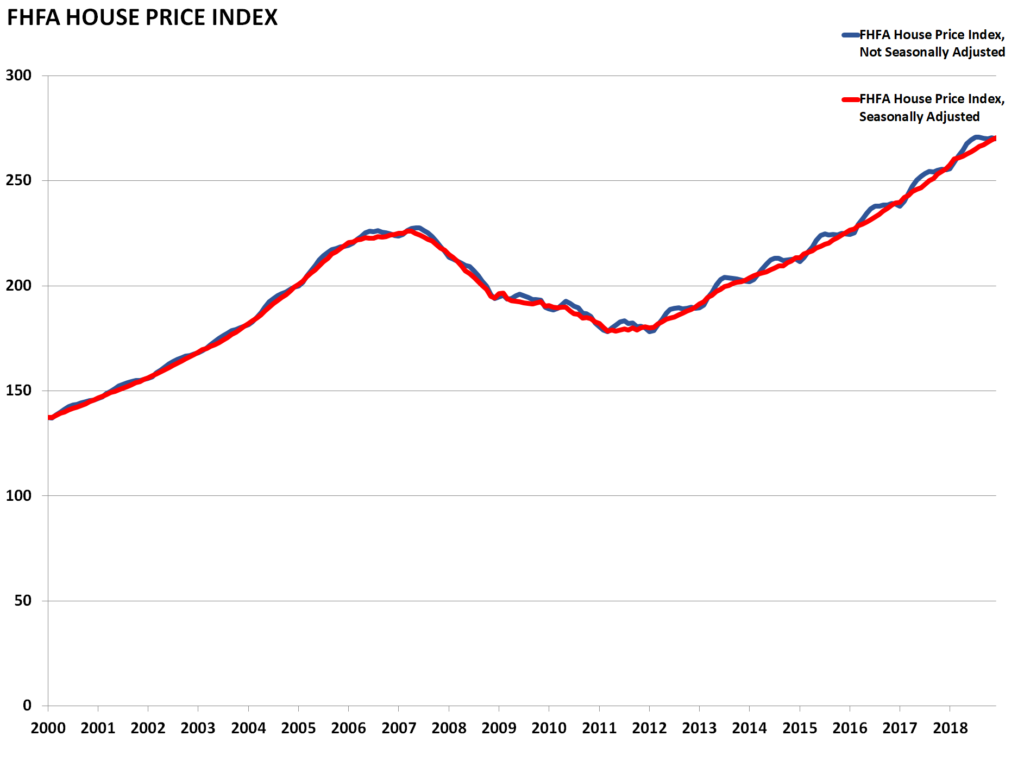
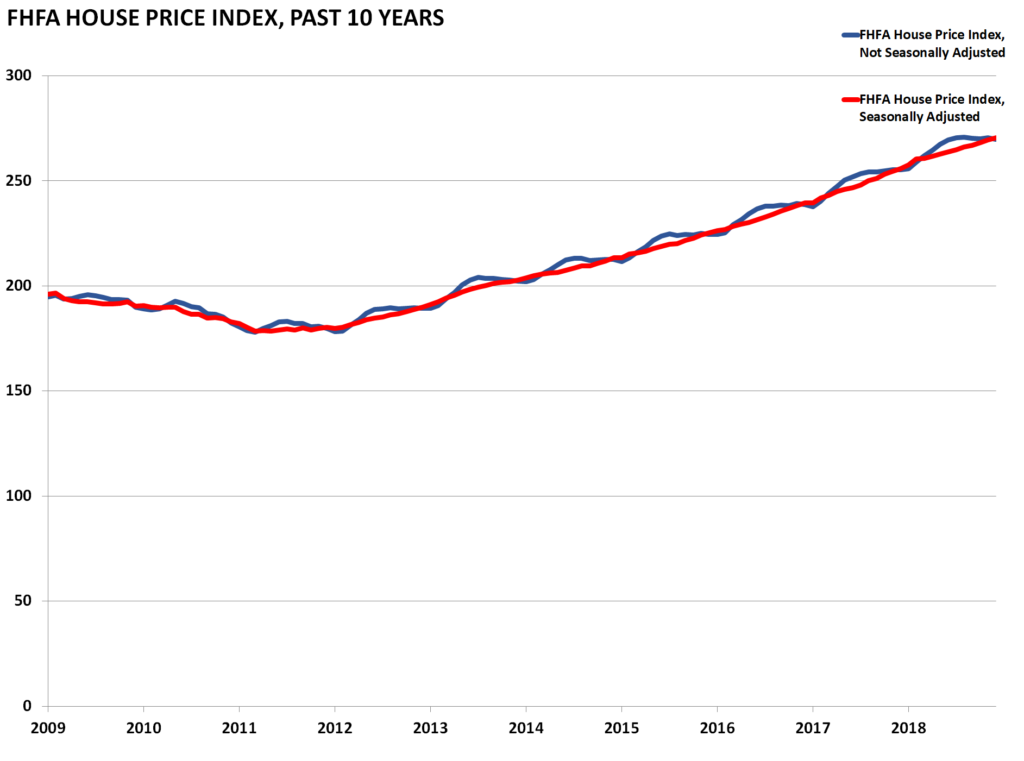
Similar to the Case-Shiller Index, the Federal Housing Finance Agency’s House Price Index (HPI) is a broad measure of single-family house prices. Information for the index is derived from properties whose mortgages have been purchased or securitized by Fannie Mae or Freddie Mac from all 50 states and the DC area.
Source: https://www.fhfa.gov/DataTools/Downloads/Pages/House-Price-Index-Datasets.aspx#mpo
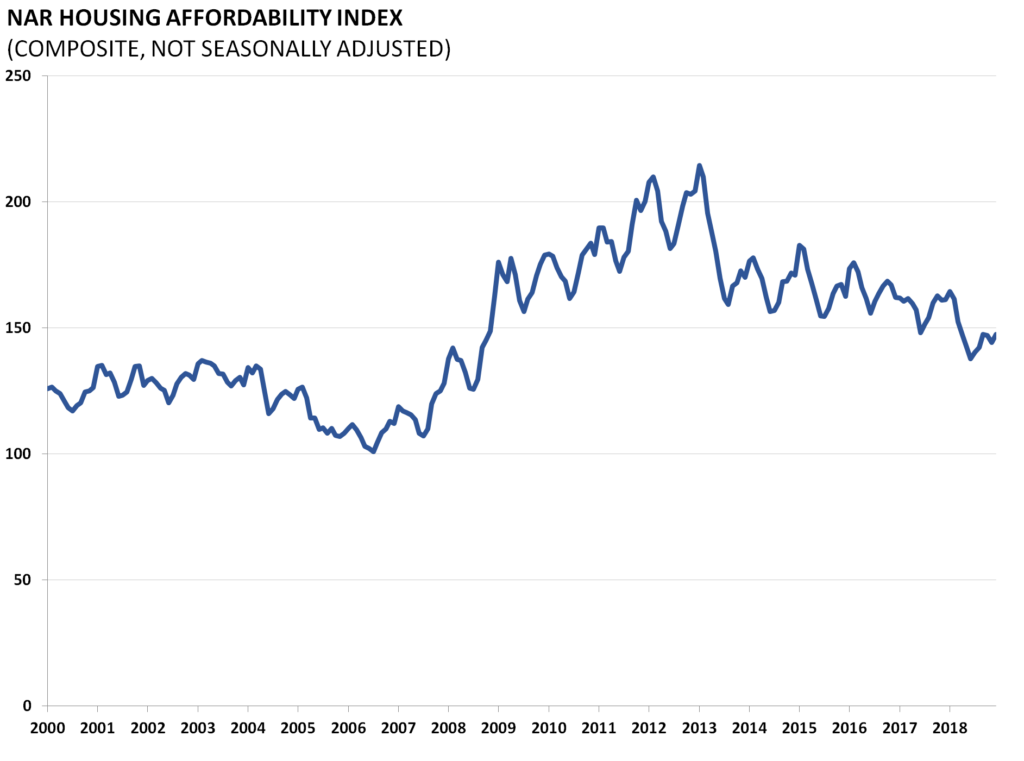
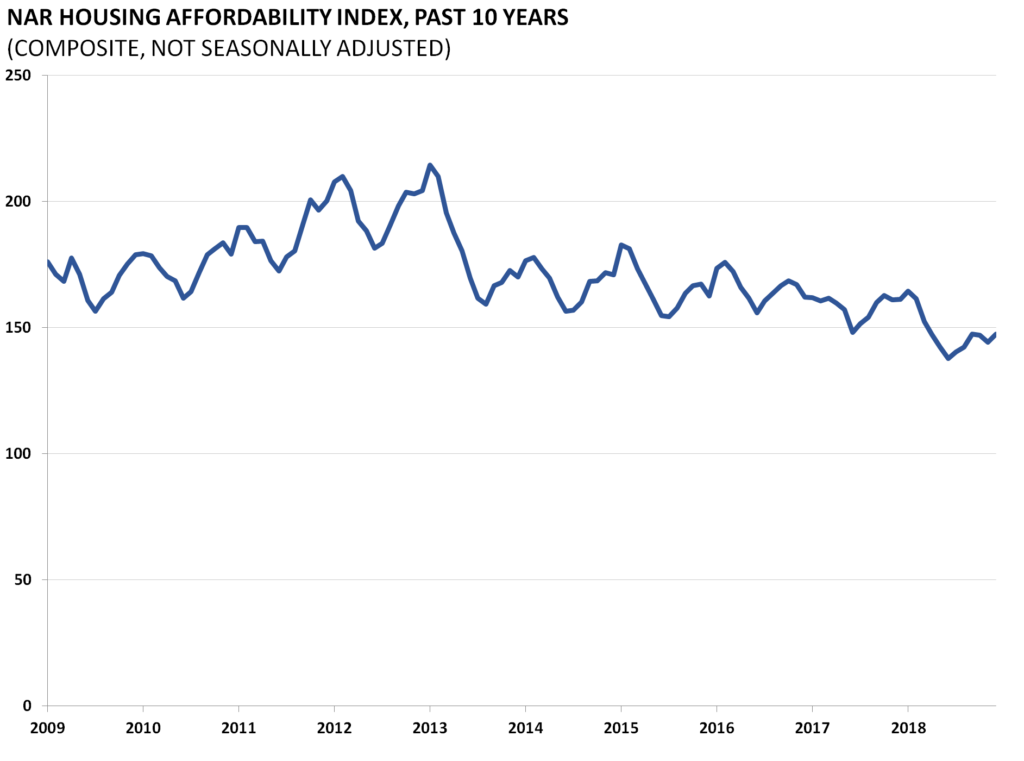
The National Association of Realtors releases updated numbers on housing affordability monthly. The measure is an index in which the value of 100 means a family has exactly enough income to quality for a mortgage on a median-priced home. Measures above 100 mean that a family has more than enough income to qualify. Since the housing bubble, home affordability has been high, a positive sign for a recovery in demand.
Source: http://research.stlouisfed.org/fred2/series/COMPHAI
Data Release: http://www.realtor.org/topics/housing-affordability-index


