


The Daily Dish
September 29, 2023
Whither Economic Growth?
It is an enormous understatement to say that the economic outlook is a bit cloudy at the moment. (To keep up to date, check out the AAF Weekly Economic Tracker.) To cut through the chatter, I remind myself of something Eakinomics discussed last year.
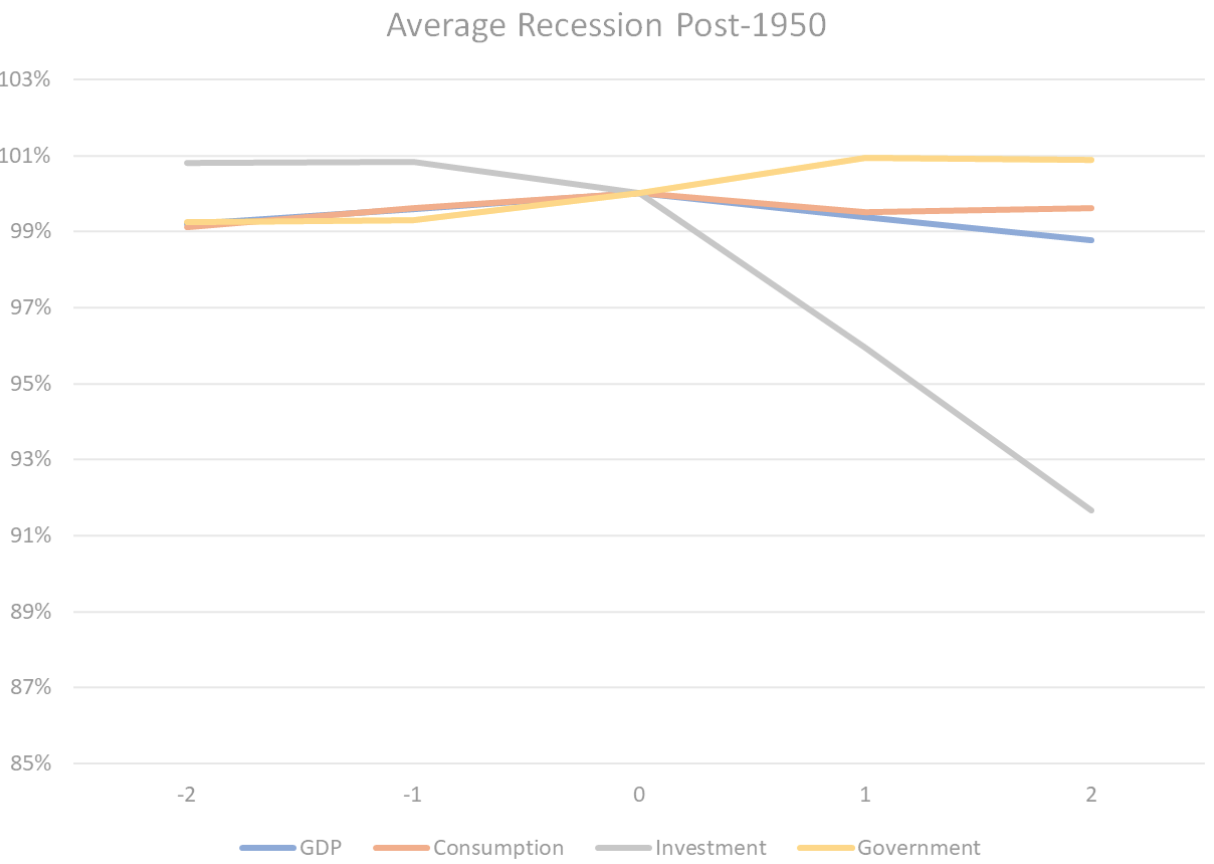
In the chart below, “0” represents the quarter designated by the National Bureau of Economic Research as the business cycle peak. The height of each line represents the value as a percentage of its level at the peak quarter. So, by definition, gross domestic product (GDP) was 100 percent of the peak value in the peak quarter, and it declined as time elapsed one and two quarters from the peak. Notice, however, that the decline in GDP was more than exceeded by a decline in business investment spending. Moreover, the decline in business investment begins one quarter before the decline in GDP, as well as before the decline in household consumption spending.
What, then, do we know about the outlook for investment spending? The single best predictor of changes in business investment is new orders for durable goods, i.e., capital goods.
With that in mind, consider the next chart. It compares the year-over-year growth in quarterly new orders for non-defense capital goods excluding aircraft and the same growth of non-residential fixed investment. (Details: Aircraft orders are quite volatile and excluded for that reason and both series are measured in nominal terms for simplicity.)
As with the link between investment downturns and declines in GDP, there is a link between downturns in new orders (blue line) and investment spending (orange line). Orders are a good predictor of weak investment spending, with a lead time of roughly a quarter or two.
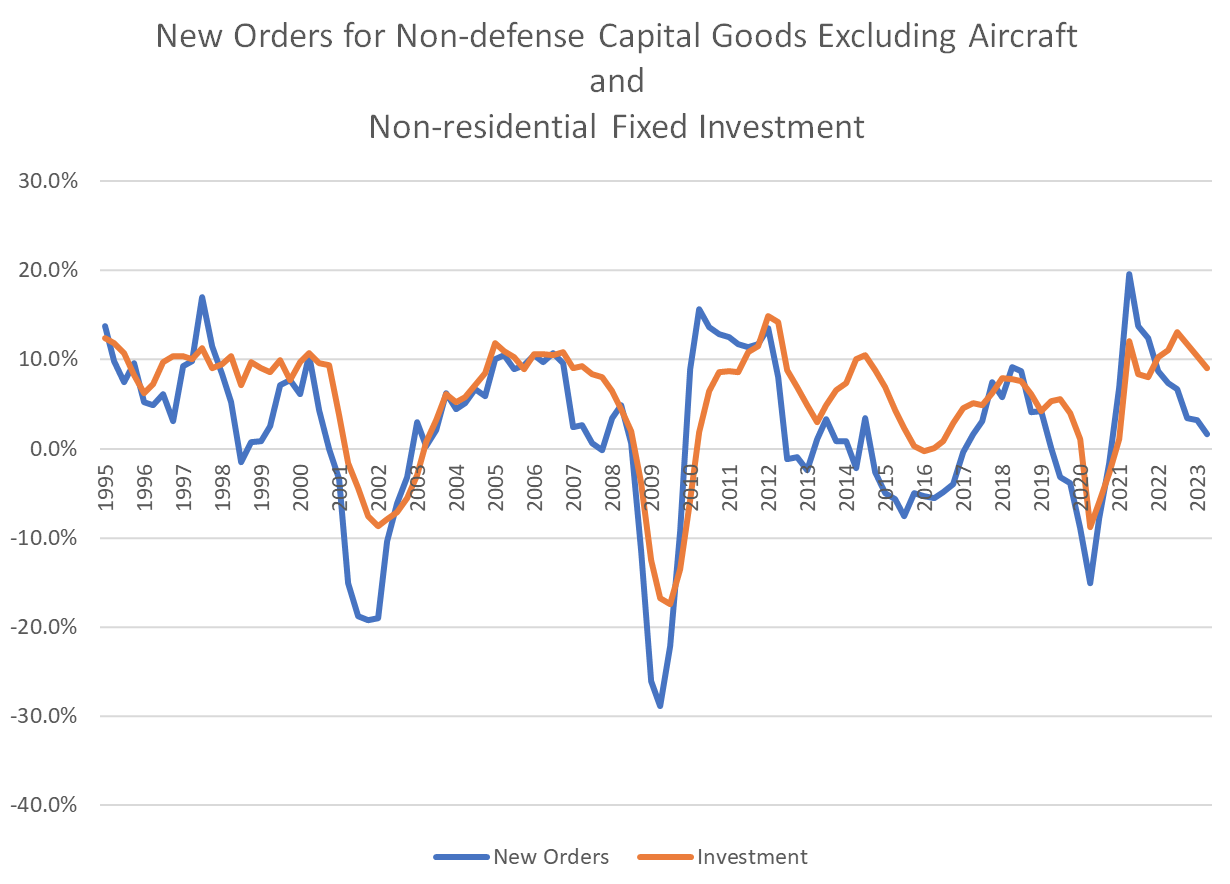
This is a bit troubling at the moment. Orders were growing at nearly a 20 percent rate at the start of last year but have fallen to 1.7 percent in the 2nd quarter of 2023. This bodes poorly for investment spending in the 2nd half of 2023.
At least to my eye, the “soft landing” is far from guaranteed and there is good reason to be cautious about the outlook for the remainder of 2023 and early 2024.
Fact of the Day
Since January 1, the federal government has published rules that imposed $529.4 billion in total net costs and 161.1 million hours of net annual paperwork burden increases.
