Research
September 17, 2024
Expanding the Child Tax Credit by Raising the Corporate Rate: The Macroeconomic Impact
Executive Summary
- A popular proposal among both progressives and some conservatives is to make permanent the American Rescue Plan (ARP) version of the expanded child tax credit (CTC). Advocates argue that its work disincentives for parents are minimal and the long-run economic and social benefits to children would exceed the cost.
- Another popular proposal is to raise the corporate income tax rate. President Biden and Vice President and presidential candidate Harris propose raising the rate to 28 percent, arguing: “Corporations received an enormous tax break in 2017. While their profits soared, their investment in their workers and the economy did not.”
- Connecting the dots, progressives and even some on the right may favor a permanently expanded CTC paid for by raising the corporate tax rate; this paper examines the macroeconomic impacts of such a policy change.
- The detailed budgetary and economic analysis conducted by EY yields two headline conclusions: (1) the budget cost of such a CTC would be enormous and would require a full 10-percentage-point increase in the corporate rate to pay for it, and (2) the negative economic impact of raising the corporate rate would vastly outweigh any economic returns of expanding the CTC.
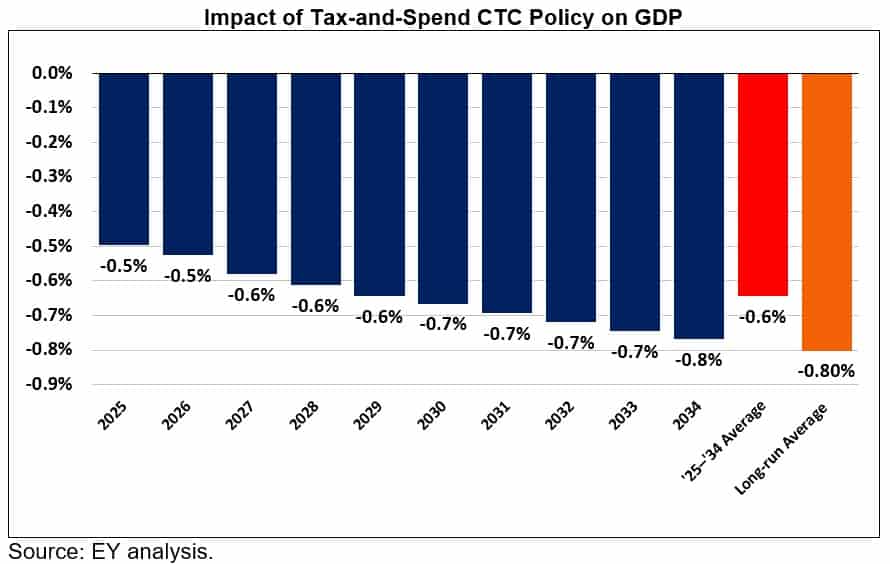
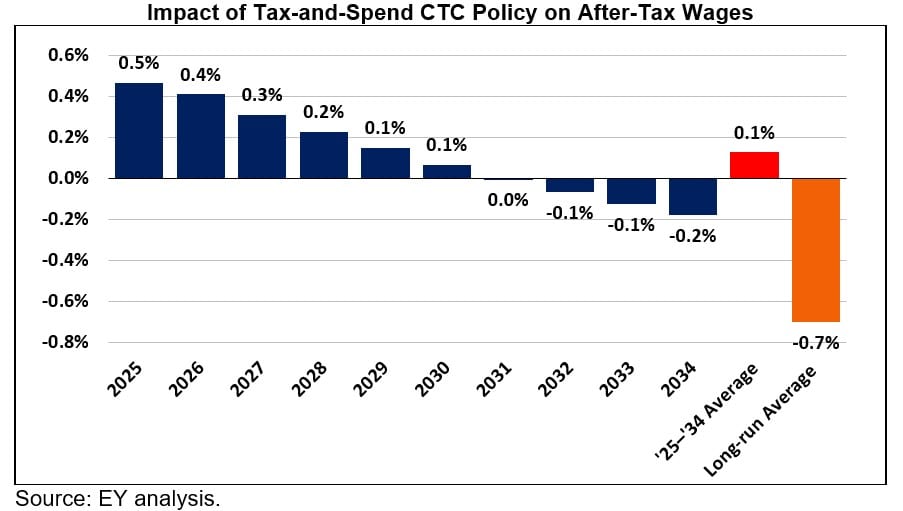
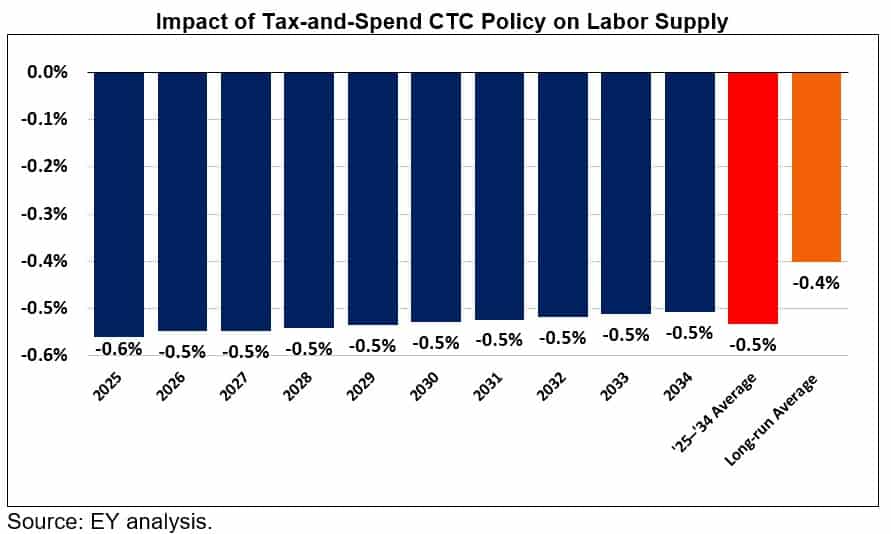
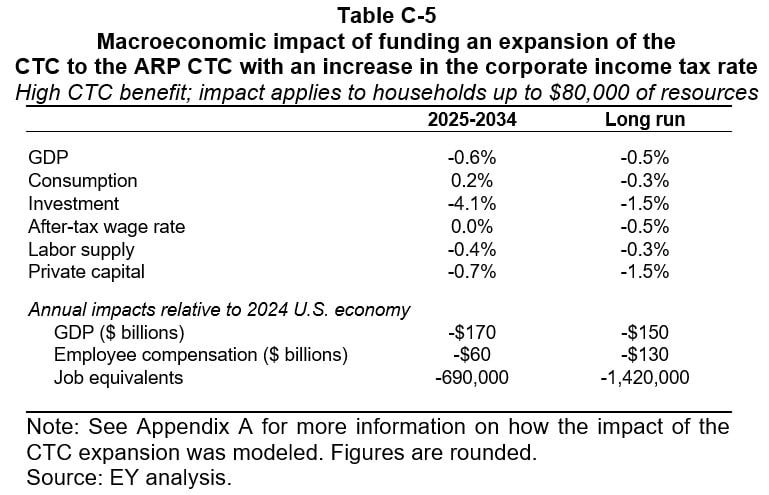
- Combined, a permanently expanded CTC and 10-percentage-point increase in the corporate tax rate would have negative impacts on investment and overall gross domestic product (GDP). In the first years, the CTC would support some additional household consumption spending. Over time, however, even in the best-case scenario for the CTC, labor supply would fall by 0.4 percent, after-tax wages by 0.3 percent, consumption by 0.1 percent, investment by 1.2 percent, and GDP by 0.4 percent.

Introduction
The past decade saw vigorous debates over tax policy, with two key policies garnering the lion’s share of the attention: the corporate income tax rate and the child tax credit (CTC). In 2017, the Tax Cuts and Jobs Act (TCJA) reduced the corporate rate from 35 percent to 21 percent. Advocates, including former President and presidential candidate Trump, argue that the change (along with other corporate reforms) stemmed the loss of U.S. headquarters to foreign countries and provided incentives to locate investment, research, intellectual property, and thus hiring, in the United States. Critics, including President Biden and Vice President and presidential candidate Harris, propose reversing the reduction, at least in part, arguing: “Corporations received an enormous tax break in 2017. While their profits soared, their investment in their workers and the economy did not.”
The TCJA also expanded the CTC, but not to the satisfaction of proponents. Instead, an even more generous, but temporary, CTC was included in the 2021 American Rescue Plan (ARP). Advocates would prefer to see the ARP policy made permanent on the grounds that “in addition to short-run relief from hardship, income support can bring long-run gains in children’s health, education, and earnings, a mounting body of research finds.” Perhaps unsurprising is that critics argue the opposite, pointing to work disincentives for parents and meager returns in the form of benefits to children in their future. Both the Harris and Trump presidential campaigns have proposed substantially expanding CTC maximum credit amounts.
To shed light on these issues, the American Action Forum (AAF) sought to better understand the empirical magnitudes of the impacts. To move past a qualitative discussion of the policies requires a formal model of the U.S. economy. AAF retained EY’s Quantitative Economics and Statistics (QUEST) Group to conduct the analysis. EY’s “overlapping generations model” (see the Appendices) is similar to those used by the Congressional Budget Office (CBO), the Joint Committee on Taxation (JCT), and the U.S. Department of the Treasury. It thus embodies the consensus impacts in the research literature.
In doing so, AAF was careful to not influence the results, delegating to EY all judgments regarding the key parameters and conclusions of the research literature. Our summary of the nature of the policy question and the conclusions of the analysis are below.
Overview of Recent Child Tax Credit Laws
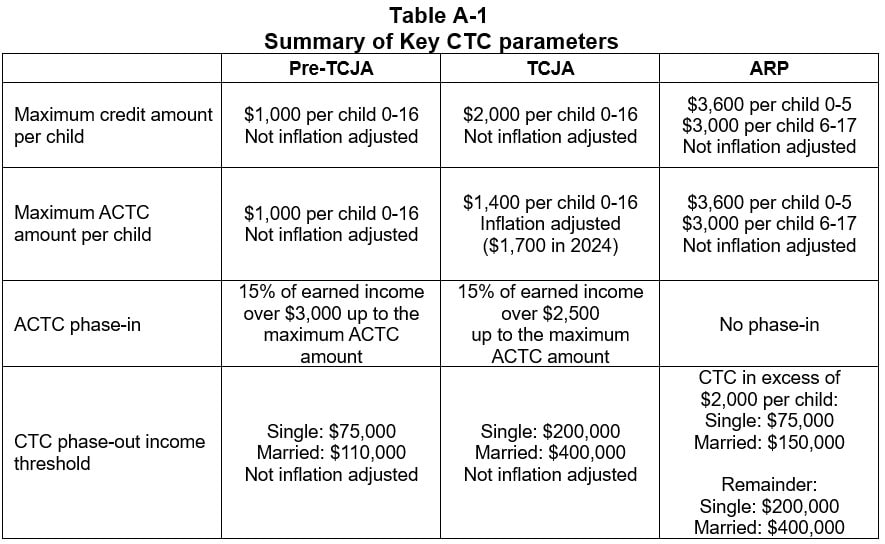
The CTC allows taxpayers to claim a tax credit for qualifying children. The CTC was temporarily expanded in the 2017 TCJA and the 2021 ARP. A high-level description of the CTC under three different laws – pre-TCJA law (before 2018 and after 2025), TCJA law (2018–2020 and 2022–2025), and ARP law (2021) is displayed in Table 1.

This analysis models the impact of making the ARP’s CTC policy permanent starting in 2025 relative to a current-law baseline, which is estimated to cost approximately $1.4 trillion over the 2025–2034 budget window.[1],[2]
Pre-TCJA law (before 2018 and after 2025)
Under pre-TCJA law, households could receive a tax credit up to $1,000 per child under the age of 17. The refundable portion of the credit, known as the additional child tax credit (ACTC), phased in at a rate of $0.15 per dollar of earned income over $3,000 with the maximum refundable portion equal to $1,000 per child. The credit phased out at a rate of $50 per $1,000 of income starting at a threshold of $75,000 for single individuals and $110,000 for married households filing jointly. These parameters were not indexed for inflation.
TCJA law (2018–2020 and 2022–2025)
The TCJA temporarily doubled the value of the CTC from $1,000 to $2,000 per child (not adjusted for inflation) under the age of 17, with the maximum refundable portion equal to $1,400 per child (adjusted for inflation). The refundable portion of the credit phases in at a rate of $0.15 per dollar of earned income over $2,500 (not adjusted for inflation). It phases out at a rate of $50 per $1,000 of income starting at a threshold of $200,000 for single individuals and $400,000 for married households filing jointly (not adjusted for inflation). These changes, similar to certain other individual income tax provisions enacted under the TCJA, sunset at the end of 2025.
ARP law (2021)
The ARP temporarily increased the value of the CTC to $3,000 per child aged 6–17 and to $3,600 per child aged 0–5 and made it fully refundable with no phase-in. The CTC in excess of $2,000 per child phases out at a rate of $50 per $1,000 of income starting at a threshold of $75,000 for single individuals and $150,000 for married households filing jointly. The remainder of the credit phases out at a rate of $50 per $1,000 of income starting at a threshold of $200,000 for single households and $400,000 for married households filing jointly. The ARP also allowed 50 percent of the credit to be paid out in monthly installments in advance of 2021 tax returns being filed. These parameters also broadly align with those proposed in the Biden Administration’s Fiscal Year 2025 Budget.[3]
Analytic Issues
To complete the analysis requires understanding the impact of the corporate rate on economic activity, as well as the impact of the CTC on child poverty, parental work, and earnings. These serve as precursors to the inputs to the EY macroeconomic model. These issues are discussed in detail in the Appendices.
Basic Results
What Is the Corporate Rate?
The starting point for this analysis was the estimated corporate tax rate required to cover the cost of the permanent, expanded CTC. As noted in the introduction, President Biden has proposed raising the corporate rate to 28 percent. Candidate Harris proposed returning the rate to 35 percent in her 2020 presidential campaign but has no new proposals to date this year.
The cost of a permanent, expanded CTC – roughly $1.4 trillion over the 2025–2034 budget window – would require an increase in the corporate rate of 10 percentage points, bringing the rate to 31 percent. This would be about 5 percentage points above the average for Organisation for Economic Co-operation and Development countries and would put the United States in the upper tail of the global corporate rate distribution.

Macroeconomic Impacts
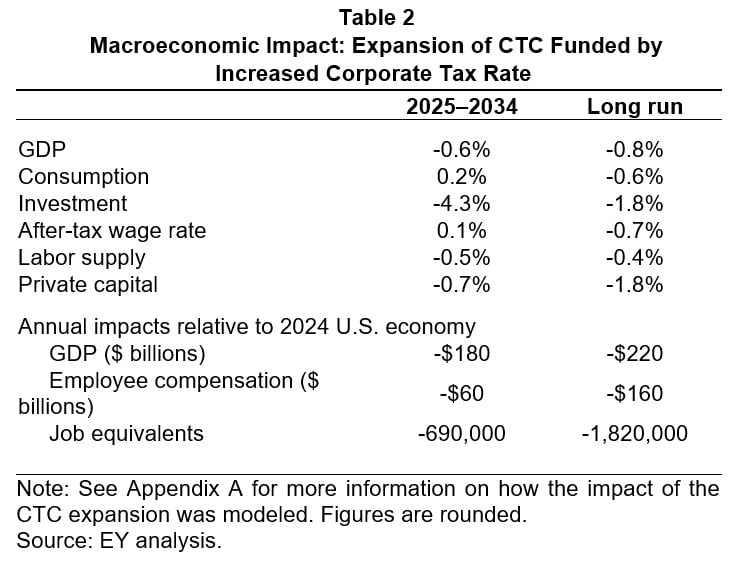
What happens to the trajectory of the economy if the tax-and-spend CTC policy is adopted? The basic results are shown in Table 2. Over the first decade, the additional cash flow of the CTC stimulates consumption, which is up 0.2 percent. The policy, however, has a strongly negative impact on the supply side of the economy – capital investment and labor supply – with a 0.6 percent contraction in gross domestic product (GDP). After-tax wages do rise, but the negative impact on overall employment means that total compensation to labor declines (see bottom).
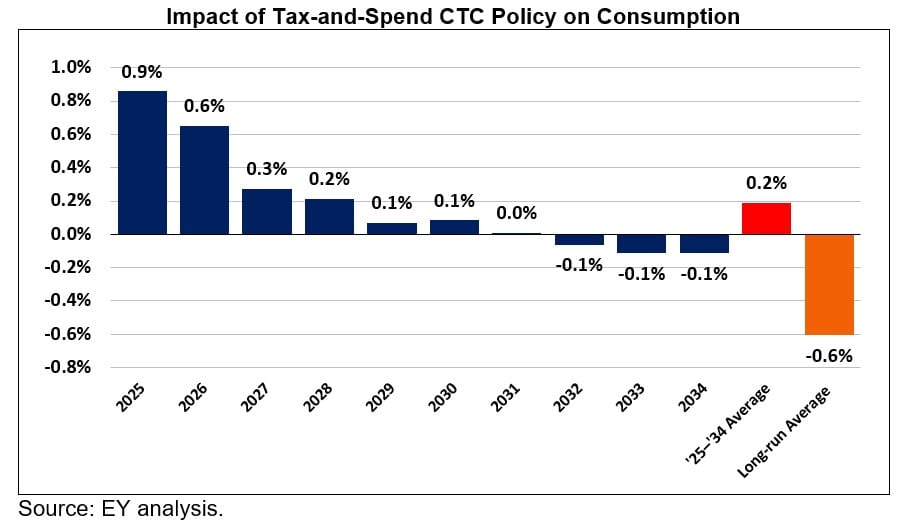
Over the long term, even the modest increases are reversed as the decline in capital accumulation and GDP generates lower real wage growth and reduced consumption. From a macroeconomic perspective, this implies that the CTC expansion is not – in total, if not for everyone – an economic benefit for the children themselves.
Sensitivity Analysis
As detailed in the Appendices, the research literature does not come to a firm conclusion on the net benefits of the expanded CTC. To accommodate this, EY undertook three separate simulations showing the implications of a small, medium, and large net benefits from expanding the CTC. Similarly, EY also varied the size of the affected population of households, thus affecting the number of children who receive the expanded CTC.
These sensitivity tests alter the numerical estimates that appear in Table 2. In no case do they change the character of the results, however. In the near-term, only the after-tax real wage and consumption spending rise. In the long run, the aggregate impacts are uniformly negative.
Appendices
The below appendices: 1) summarize the Child Tax Credit (CTC) under different laws, estimates of its impact on child poverty, parental work, and earnings, as well how the CTC inputs to the EY Macroeconomic Model (Appendix A), 2) describe the EY Macroeconomic Model (Appendix B), 3) present estimated macroeconomic impacts (Appendix C), and 4) present caveats and limitations (Appendix D).
Appendix A. Child Tax Credit
This appendix summarizes the CTC under different laws and estimates its impact on child poverty, parental work, and the adult earnings of children that receive the CTC. These three metrics are the focus of this appendix to parallel the academic literature. The latter two metrics are inputs to the EY Macroeconomic Model.
Overview of pre-TCJA, TCJA, and ARP CTC law
The CTC allows taxpayers to claim a tax credit for qualifying children. The CTC was temporarily expanded under the Tax Cuts and Jobs Act (TCJA) and the American Rescue Plan Act of 2021 (ARP). A high-level description of the CTC under three different laws – pre-TCJA law (before 2018 and after 2025), TCJA law (2018-2020 and 2022–2025), and ARP law (2021) is displayed in Table A-1.
This analysis models the impact of making the ARP CTC permanent starting in 2025 relative to the current-law baseline, which is estimated to cost approximately $1.4 trillion over the 2025-2034 budget window.[4] [5]
Pre-TCJA law (before 2018 and after 2025)
Under pre-TCJA law, households can receive a credit of up to $1,000 per child under age 17. The refundable portion of the credit, known as the additional child tax credit (ACTC), phases in at a rate of $0.15 per dollar of earned income over $3,000 with the maximum refundable portion equal to $1,000 per child. The credit phases out at a rate of $50 per $1,000 of income starting at a threshold of $75,000 for single individuals and $110,000 for married households filing jointly. These parameters are not indexed for inflation.
TCJA law (2018—2020 and 2022—2025)
The TCJA temporarily doubled the value of the credit from $1,000 to $2,000 per child (not adjusted for inflation) under age 17 with the maximum refundable portion equal to $1,400 per child (adjusted for inflation). The refundable portion of the credit phases in at a rate of $0.15 per dollar of earned income over $2,500 (not adjusted for inflation). It phases out at a rate of $50 per $1,000 of income starting at a threshold of $200,000 for single individuals and $400,000 for married households filing jointly (not adjusted for inflation). These changes, similar to certain other individual income tax provisions enacted under the TCJA, sunset at the end of 2025.
ARP law (2021)
The ARP temporarily increased the value of the credit to $3,000 per child aged 6-17 and $3,600 per child aged 0-5 and made it fully refundable with no phase-in. The CTC in excess of $2,000 per child phases out at a rate of $50 per $1,000 of income starting at a threshold of $75,000 for single individuals and $150,000 for married households filing jointly. The remainder of the credit phases out at a rate of $50 per $1,000 of income starting at a threshold of $200,000 for single households and $400,000 for married households filing jointly. The ARP also allowed 50% of the credit to be paid out in monthly installments in advance of 2021 tax returns being filed. These parameters broadly align with those proposed in the Administration’s Fiscal Year 2025 Budget.[6]
Estimated reduction in child poverty due to a permanently expanded CTC
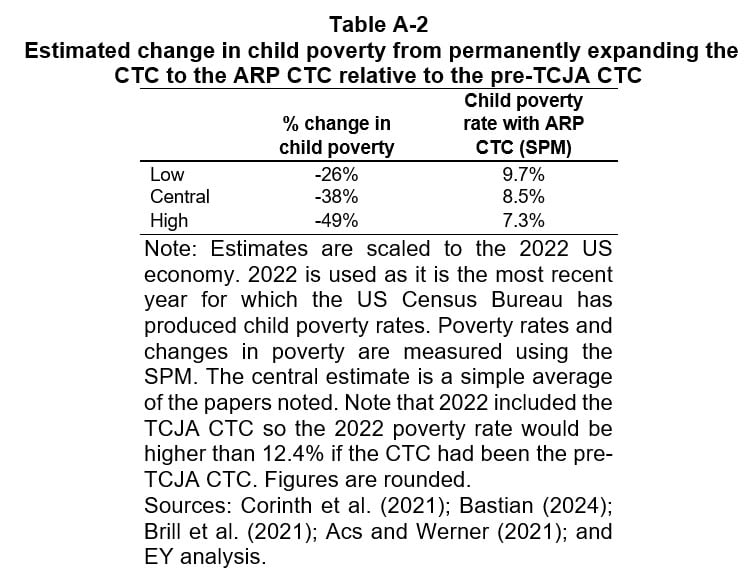
Multiple papers have estimated the impact of a permanently expanded CTC on child poverty, all finding that it reduces child poverty. This analysis reviewed four papers examining the potential impact of a permanently expanded CTC to produce a range of the potential impact (Table A-2).[7] Papers examining the impact of the ARP CTC for 2021 were excluded.[8] This is because the CTC expansion was temporary and the full effects of this policy change are expected to take several years to phase-in. Specifically, the papers that study the impact of the temporary change may underestimate the long-term labor supply impacts and overstate the impact on child poverty.[9]
All of this research measures poverty using the Supplemental Poverty Measure (SPM).[10] In contrast to the official poverty measure, which estimates the ratio of pre-tax income to a national threshold (adjusted for household size), the SPM includes a broader definition of expenditures and income and adjusts for differences in the cost of living by geography, housing costs, and household size. Specifically, the SPM accounts for cash income plus additional income from tax credits (such as the Earned Income Tax Credit (EITC) and CTC) and government transfers (such as the Supplemental Nutrition Assistance Program (SNAP), Special Supplemental Nutrition Program for Women, Infants and Children (WIC), school lunch, energy assistance, and housing subsidies). It also subtracts costs such as work expenses (e.g., childcare), child support, and medical expenses. A family with two adults and two children that rents their home in the New York City metro area, for example, would have an SPM threshold of $40,696 while that same family in the Dallas metro area would have a SPM threshold of $36,552 in 2022.[11]
According to the U.S. Census Bureau, the child poverty rate was 12.4% in 2022 using the SPM, the most recent year for which poverty measures were published.[12] This corresponds to 9 million out of 72.5 million children under 18 in the United States. Note, however, that the TCJA CTC was in effect during 2022.
The research used in this analysis to produce a range of estimates for the reduction in child poverty from permanently expanding the CTC to be the ARP CTC are Corinth et al. (2021), Bastian (2024), Brill et al. (2021), and Acs and Werner (2021). Generally, these papers present results for a permanent CTC expansion relative to a TCJA CTC baseline. This analysis adjusts that baseline to a pre-TCJA CTC baseline using an estimate from Bastian (2024).[13] Where multiple estimates of the change in child poverty were presented in a paper, the paper’s preferred estimate was used.
- Corinth et al. (2021): A permanent expansion of the CTC to the ARP CTC would reduce child poverty by 22% relative to a TCJA CTC, scaled to 26% relative to a pre-TCJA CTC.
- Bastian (2024): A permanent expansion of the CTC to the ARP CTC would reduce child poverty by 28% relative to a TCJA CTC, scaled to 33% relative to a pre-TCJA CTC.
- Brill et al. (2021): A permanent expansion of the CTC to the ARP CTC would reduce child poverty by 36% relative to a TCJA CTC, scaled to 42% relative to a pre-TCJA CTC.
- Acs and Werner (2021): A permanent expansion of the CTC to the ARP CTC would reduce child poverty by 41% relative to a TCJA CTC, scaled to 49% relative to a pre-TCJA CTC.
This research broadly finds that permanently expanding the CTC to the ARP CTC relative to a pre-TCJA CTC would reduce child poverty by between 26% and 49% with a central estimate of 38% (see Table A-2). This implies that expansion of the CTC to ARP CTC law would decrease the child poverty rate from 12.4% to between 7.3% and 9.7% (in 2022).
Estimated reduction in parents working due to a permanently expanded CTC
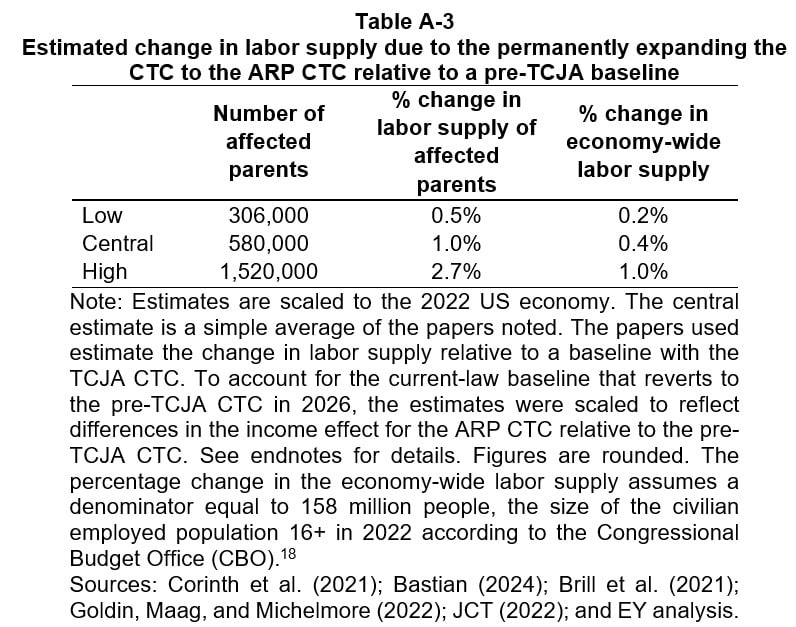
The variation in the estimated impact of an expanded CTC on child poverty rates from the academic literature can, in part, be explained by how researchers account for the parents’ labor supply response to an increase in the CTC. The five papers summarized below estimate the labor supply impact from a permanently expanded CTC. Three of the four papers – Corinth et. al (2021), Bastian (2024), and Brill et. al (2021) – were also cited above regarding child poverty reduction. Two additional papers – Goldin, Maag, and Michelmore (2022) and Joint Committee on Taxation (JCT) (2022) – do not provide estimates of the reduction in child poverty but do provide parent labor supply impacts.[14]
As noted above, the research examining the labor supply impact of the temporary ARP CTC for 2021 were excluded.[15] These papers generally find no labor supply impact. This is likely because the CTC expansion was temporary and, accordingly, these papers could underestimate the long-term labor supply impacts from a permanent expansion.
All of the research used for this analysis present results of a permanent CTC expansion relative to the TCJA CTC baseline. This analysis adjusts that baseline to a pre-TCJA CTC baseline based on the size of the ARP CTC relative to the pre-TCJA CTC.[16] Where multiple estimates are presented in a paper, the authors’ preferred estimate is used.
- Corinth et. al (2021) estimates that 1.46 million (1.52 million scaled to the pre-TCJA CTC to ARP CTC change) working parents would leave the labor force due to a permanent expansion of the CTC to the ARP CTC, corresponding to 2.6% of all working parents (2.7% scaled to the pre-TCJA CTC to ARP change).
- Bastian (2024) estimates that 367,000 working parents would leave the labor force due to a permanent expansion of the CTC to the ARP CTC, corresponding to 0.7% of all working parents. Bastian (2024) assumes there is no income effect from the policy change, so the author’s results are not scaled.
- Brill et al. (2021) estimates that 296,000 (307,000 scaled) full-time equivalent workers would exit the labor force due to a permanent expansion of the CTC to the ARP CTC, corresponding to 0.5% of all working parents (0.6% scaled).
- Goldin, Maag, and Michelmore (2022) estimate that 386,000 (401,000 scaled) working parents would leave the labor force due to a permanent expansion of the CTC to the ARP CTC, corresponding to 0.7% of all working parents (0.7% scaled).
- JCT (2022) estimates that 251,000 (306,000 scaled) workers would leave the labor force due to a permanent expansion of the CTC to the ARP CTC, corresponding to 0.5% of all working parents (0.6% scaled).[17]
These papers account for both the income and substitution effects. The income effect refers to the change in the quantity of labor supplied resulting from a change in a worker’s income, holding wages constant; typically, as income rises, workers may choose to work less because they can maintain their desired standard of living with fewer hours worked. The substitution effect occurs when a change in wages alters the relative price of leisure and labor, leading workers to substitute labor for leisure (or vice versa); specifically, when wages increase, leisure becomes more expensive in terms of forgone earnings, prompting individuals to work more and consume less leisure. The relative sizes of the income and substitution effects, as well as variation across taxpayer types (e.g., single mothers, married couples, etc.), are a primary driver of differences in the impacts of the CTC on labor supply.
Overall, as displayed in Table A-3, based on this research, permanently expanding the CTC to the ARP CTC relative to a pre-TCJA CTC would reduce the number of working parents by between 306,000 and 1.5 million with a central estimate of 580,000. There were approximately 56 million working parents in 2022. This implies that the percent change in the labor supply of working parents would decline by between 0.5% and 2.7% and the economy-wide labor supply would decline by between 0.2% and 1.0%.
Estimated earnings impact from a reduction in parents working
Changes in the labor supply impact the household resources available to children as well as aggregate economic activity. To estimate the fully phased-in impact of this reduction in labor supply, these low, central, and high percent changes in labor supply were applied to microdata on CTC recipients from the US Census Bureau’s Current Population Survey for 2022.
This analysis assumes that 72% of the labor supply impact is from working parents in households with total resources under $50,000. This follows the distribution of the labor supply impact estimated by Corinth et. al (2021). The remaining 28% is at households with total resources under $80,000 or $100,000 (depending on the scenario). The two scenarios reflect the variations in the cited literature about where the impacts of an additional dollar of income have no effect. For example, Bastian (2024) assumes the impact reaches zero at $80,000 of income, while Goldin, Maag, and Michelmore (2022) assume the impact reaches zero at $100,000.
Estimated adult earnings impact from change in children’s household income
The expanded CTC increases household income, which can influence future economic activity by increasing the resources available to households that are raising children.[19] Increases in household resources have been shown to improve outcomes such as a child’s test scores, educational attainment, and college enrollment that later impact their earnings as an adult.[20] However, reductions in household income from a parent leaving the labor force can offset household income increases from the expanded CTC. The net impact of these two factors is estimated.
Three papers estimate the impact of a policy-induced increase in household income on a child’s future adult earnings.[21] The first two directly estimate the impact in the context of the CTC. The third estimates the impact in the context of the EITC.
- Werner (2024) estimates that an increase in the CTC equivalent to the ARP expansion (a $3,994 increase, on average, across all households) would increase impacted children’s average annual adult earnings by 7.5% to 12.3% at age 30.[22] This is equivalent to a 2.5% earnings increase in adult earnings per $1,000 increase in household income.
- Goldin, Maag, and Michelmore (2022) estimate a 0.6% increase in adult earnings per $1,000 of increased household income in the context of the CTC.[23]
- Bastian and Michelmore (2018) estimate that a $1,000 increase in the EITC would increase average annual adult earnings by 2.5% for children 0-5, 0.2% for kids 6-12, and 2.2% for kids 13-18, for a weighted average increase of 1.5% per $1,000 credit increase.
The estimated impacts from this research were standardized to reflect the average annual earnings increase per $1,000 of household income received.[24] Overall, this research finds that future annual earnings could increase by, on average, 1.5% (a range of 0.6% to 2.5%) per additional $1,000 of household income received.[25]
To estimate the fully phased-in impact of this reduction in child poverty, these low, central, and high percent changes in future earnings were applied to microdata on CTC recipients from the US Census Bureau’s Current Population Survey for 2022. The following steps and assumptions were made:
- The first step was to determine the earnings of the parent at present and the child when they reach adulthood. Under the current-law baseline, it was assumed that children would have earnings equivalent to the average earnings of their parents when they reach adulthood.[26] In instances where a parent leaves the labor force, that parent’s earnings were reduced to zero.[27]
- Next the change in CTC per household was estimated. The analysis assumed resource sharing within households (e.g., children in households with more than one child share the aggregate benefit the household receives).[28]
- Finally, the full impact of the earnings increase to children living in households with resources under $50,000 was applied. Above $50,000, this analysis linearly phases out the impact of the transfer with each dollar over $50,000. Impacts are shown assuming the impact reaches zero at $80,000 or $100,000 of resources. This follows the academic literature that shows that the benefits of additional incomes for low-income children phase out in this range.[29]
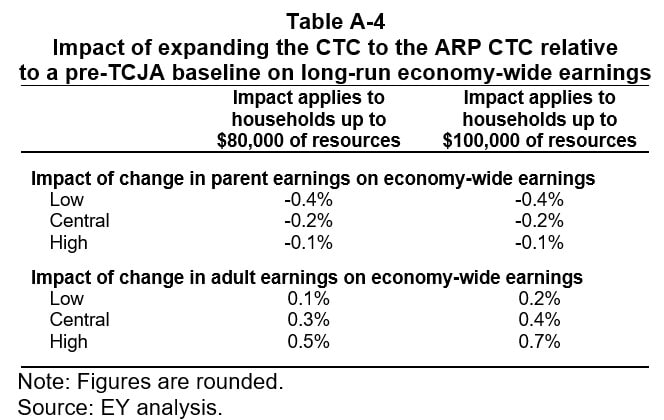
Table A-4 displays the results when restricting the impact to households with under $80,000 and $100,000 in total resources under three scenarios.[30] The low impact scenario assumes a high labor supply response (1.0% decline in labor supply) and low earnings impact (0.6% increase in future earnings per $1,000 increase in household income). The high impact scenario assumes a low labor supply response (0.2% decline) and a high earnings impact (2.5% increase). The central scenario assumes the central estimate for each (0.4% decline in labor supply and 1.5% increase in future earnings per $1,000 increase in household income).
Overall, the decrease in parent earnings from working parents leaving the labor force due to the CTC expansion is estimated to reduce economy-wide earnings by 0.1% to 0.4% with a central estimate of 0.2%. The increase in adult earnings of children receiving the CTC, accounting for the interaction with parental labor supply decisions, is estimated to increase economy-wide earnings by 0.1% to 0.7% with a central estimate of 0.3% to 0.4%.
Appendix B. EY Macroeconomic Model
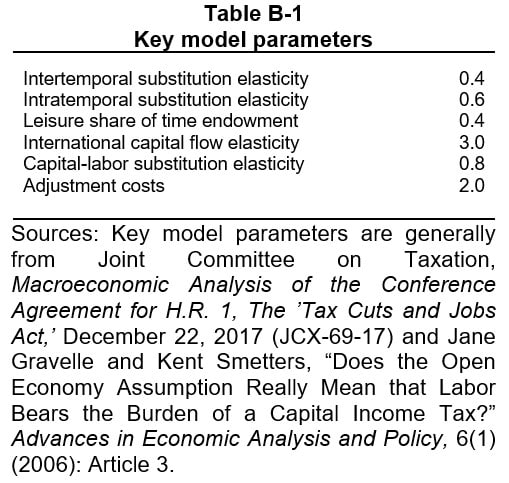
The EY Macroeconomic Model used for this analysis is similar to some of those used by the CBO, JCT, and US Department of the Treasury.[31] In this model, changes in tax policy affect the incentives to work, save and invest, and to allocate capital and labor among competing uses. Representative individuals and firms incorporate the after-tax return from work, savings, and investment, into their decisions on how much to produce, save, and work.
The general equilibrium methodology accounts for changes in equilibrium prices in factor (i.e., capital and labor) and goods markets and simultaneously accounts for the behavioral responses of individuals and businesses to changes in taxation (or other policies). Behavioral changes are estimated in an overlapping generations (OLG) framework, whereby representative individuals with perfect foresight incorporate changes in current and future prices when deciding how much to consume and save in each period of their lives.
High-level description of model’s structure
Production
Firm production is modeled with the constant elasticity of substitution (CES) functional form, in which firms choose the optimal level of capital and labor subject to the gross-of-tax cost of capital and gross-of-tax wage. The model includes industry-specific detail through use of differing costs of capital, factor intensities, and production function scale parameters. Such a specification accounts for differential use of capital and labor between industries as well as distortions in factor prices introduced by the tax system. The cost of capital measure models the extent to which the tax code discriminates by asset type, organizational form, and source of finance.
The industry detail included in this model corresponds approximately with three-digit North American Industry Classification System (NAICS) codes and is calibrated to a stylized version of the US economy. Each of 36 industries has a corporate and pass-through sector except for owner-occupied housing and government production. Because industry outputs are typically a combination of value added (i.e., the capital and labor of an industry) and the finished production of other industries (i.e., intermediate inputs), each industry’s output is modeled as a fixed proportion of an industry’s value added and intermediate inputs to capture inter-industry linkages. These industry outputs are then bundled together into consumption goods that consumers purchase.
Consumption
Consumer behavior is modeled through use of an OLG framework that includes 55 generational cohorts (representing adults aged 21 to 75). Thus, in any one year, the model includes a representative individual optimizing lifetime consumption and savings decisions for each cohort aged 21 through 75 (i.e., 55 representative individuals) with perfect foresight. The model also distinguishes between two types of representative individuals: those that have access to capital markets (savers) and those that do not (non-savers or rule-of-thumb agents).
Non-savers and savers face different optimization problems over different time horizons. Each period non-savers must choose the amount of labor they supply and the amount of goods they consume. Savers face the same tradeoffs in a given period, but they must also balance consumption today with the choice of investing in capital or bonds. The model assumes 50% of US households are permanently non-savers and 50% are permanently savers across all age cohorts.
The utility of representative individuals is modeled as a CES function, allocating a composite commodity consisting of consumption goods and leisure over their lifetimes. Representative individuals optimize their lifetime utility through their decisions of how much to consume, save, and work in each period subject to their preferences, access to capital markets, and the after-tax returns from work and savings in each period. Representative individuals respond to the after-tax return to labor, as well as their overall income levels, in determining how much to work and thereby earn income that is used to purchase consumption goods or to consume leisure by not working. In this model the endowment of human capital changes with age — growing early in life and declining later in life — following the estimate of Altig et al. (2001).[32]
Government
The model includes a simple characterization of both federal and state and local governments. Government spending is assumed to be used for either: (1) transfer payments to representative individuals, or (2) the provision of public goods. Transfer payments are assumed to be either Social Security payments or other transfer payments. Social Security payments are calculated in the model based on the 35 years in which a representative individual earns the most labor income. Other transfer payments are distributed on a per capita basis. Public goods are assumed to be provided by the government in fixed quantities through the purchase of industry outputs as specified in a Leontief function.
Government spending in the model can be financed by collecting taxes or borrowing. Borrowing, however, cannot continue indefinitely in this model. Eventually, the debt-to-GDP ratio must stabilize so that the government’s fiscal policy is sustainable. The model allows government transfers, government provision of public goods, or government tax policy to be used to achieve a selected debt-to-GDP ratio after a selected number of years. This selected debt-to-GDP ratio could be, for example, the initial debt-to-GDP ratio or the debt-to-GDP ratio a selected number of years after policy enactment.
Modeling the United States as a large open economy
The model is an open economy model that includes both capital and trade flows between the United States and the rest of the world. International capital flows are modeled through the constant portfolio elasticity approach of Gravelle and Smetters (2006).[33] This approach assumes that international capital flows are responsive to the difference in after-tax rates of return in the United States and the rest of the world through a constant portfolio elasticity expression. Trade is modeled through use of the Armington assumption, wherein products made in the United States versus the rest of the world are imperfect substitutes.
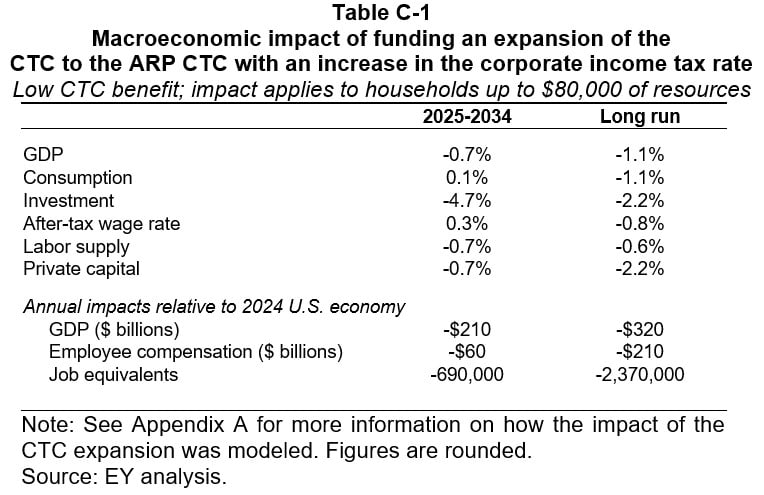
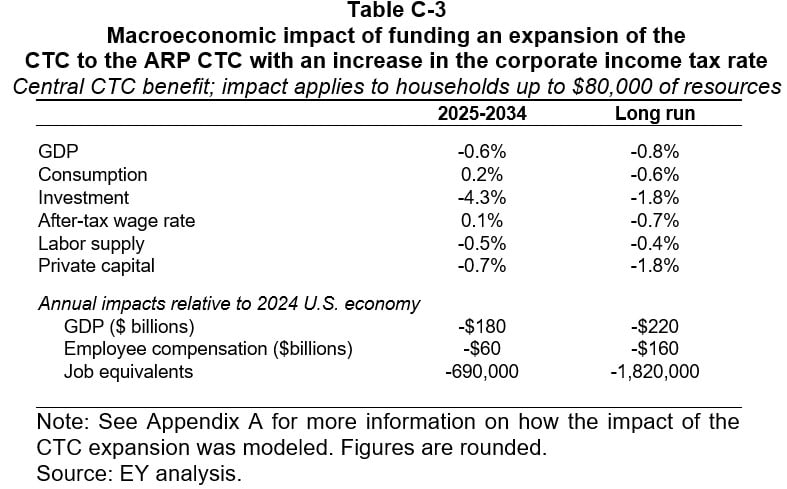
Appendix C. Macroeconomic impacts
This analysis estimates the macroeconomic impacts of expanding the CTC to the ARP CTC and funding it with a budget-neutral increase in the corporate income tax rate. This analysis estimates that the corporate income tax rate would need to be increased approximately 10 percentage points for this CTC expansion to be budget neutral over the 10-year budget window using a conventional revenue estimate.[34]


Appendix D. Caveats and limitations
Any modeling effort is only an approximate depiction of the economic forces it seeks to represent, and the economic models developed for this analysis are no exception. Although various limitations and caveats might be listed, several are particularly noteworthy:
- Estimated macroeconomic impacts are based on a stylized depiction of the U.S. economy. The macroeconomic model used for this analysis is, by its very nature, a stylized depiction of the U.S. economy. As such, it cannot capture all of the detail of the U.S. economy, the existing U.S. tax system, or the tax policy changes.
- Estimates are limited by available public information. The analysis relies on information reported by government agencies (primarily the Bureau of Economic Analysis, CBO, Census, Bureau, Internal Revenue Service, and JCT) and academic papers. The analysis did not attempt to verify or validate this information using sources other than those described in this technical appendix.
- Full employment model. The EY Macroeconomic Model, like many general equilibrium models, focuses on the longer-term incentive effects of policy changes. It also assumes that all resources throughout the economy are fully employed; that is, there is no slackness in the economy (i.e., a full employment assumption with no involuntary unemployment). Any increase in labor supply is a voluntary response to a change in income or the return to labor that makes households choose to substitute between consumption and leisure. To provide a high-level measure of the potential employment impacts, a job equivalents measure has been included in this analysis’ results. Job equivalent impacts are defined as the change in total labor income divided by the baseline average labor income per job.
- Estimated macroeconomic impacts limited by calibration. This model is calibrated to represent the US economy and then forecast forward. However, because any particular year may reflect unique events, no particular baseline year is completely generalizable.
- Industries are assumed to be responsive to normal returns on investment. The industries comprising the United States economy in the EY Macroeconomic Model are assumed to be responsive to the normal returns on investment. This contrasts to industries that earn economic profits and thereby have an increased sensitivity to statutory tax rates relative to marginal effective tax rates.
- CTC estimates depend on behavioral responses to the policy change. Specifically, the labor supply elasticities and earnings impacts are uncertain and based on results from the economic literature. Results are presented as a range in order to highlight this uncertainty. To the extent that households respond differently than the literature suggests, the results of this analysis could change.
- Estimates depend on the assumed policy baseline. This analysis estimates the macroeconomic impacts of expanding the CTC to the ARP CTC and funding it with a budget-neutral increase in the corporate income tax rate relative to the current-law baseline. Assuming a different policy baseline – for example, the current-policy baseline, as opposed to the current-law baseline – would result in a 5-percentage point increase in the corporate rate rather than 10 percentage points and different macroeconomic estimates than those produced by this analysis.[35]
Endnotes
[1] The current-law baseline includes one year of the TCJA CTC (2025) and the pre-TCJA CTC thereafter (2026 and thereafter).
[2] This revenue estimate heavily relies on the revenue estimate in Joint Committee on Taxation, Macroeconomic Analysis of a Permanent Child Tax Credit Expansion, October 2022. JCT estimates that a proposal to extend and make permanent the modifications of the CTC under the ARP beginning in calendar year 2023 would reduce federal revenues by nearly $1.3 trillion over the 2023-2032 budget window. Note that the budget window used in this analysis (2025-2034) differs from that of the JCT analysis (2023-2032).
[3] The Administration’s Fiscal Year 2025 Budget proposes to (1) increase the maximum credit per child to $3,600 for qualifying children under age 6 and to $3,000 for all other qualifying children, (2) phase out the portion of the credit in excess of $2,000 with income in excess of $75,000 for single individuals and $150,000 for married households filing jointly, and (3) increase the maximum age to qualify for the CTC from 16 to 17, among other changes. See US Department of the Treasury, General Explanations of the Administration’s Fiscal Year 2025 Revenue Proposals, March 2024.
[4] The current-law baseline includes one year of the TCJA CTC (2025) and the pre-TCJA CTC thereafter (2026 and thereafter).
[5] This revenue estimate heavily relies on the revenue estimate in Joint Committee on Taxation, Macroeconomic Analysis of a Permanent Child Tax Credit Expansion, October 2022. JCT estimates that a proposal to extend and make permanent the modifications of the CTC under the ARP beginning in calendar year 2023 would reduce federal revenues by nearly $1.3 trillion over the 2023-2032 budget window. Note that the budget window used in this analysis (2025-2034) differs from that of the JCT analysis (2023-2032).
[6] The Administration’s Fiscal Year 2025 Budget proposes to (1) increase the maximum credit per child to $3,600 for qualifying children under age 6 and to $3,000 for all other qualifying children, (2) phase out the portion of the credit in excess of $2,000 with income in excess of $75,000 for single individuals and $150,000 for married households filing jointly, and (3) increase the maximum age to qualify for the CTC from 16 to 17, among other changes. See US Department of the Treasury, General Explanations of the Administration’s Fiscal Year 2025 Revenue Proposals, March 2024.
[7] See the following papers:
Corinth, K., Meyer, B., Stadnicki, M., & Wu, D. (2021). The anti-poverty, targeting, and labor supply effects of the proposed child tax credit expansion. University of Chicago, Becker Friedman Institute for Economics Working Paper, (2021-115).
Bastian, J. (2024). How Would a Permanent 2021 Child Tax Credit Expansion Affect Poverty and Employment?. National Tax Journal, 77(2), 000-000.
Acs, G., & Werner, K. (2021). How a permanent expansion of the child tax credit could affect poverty. Washington, DC: Urban Institute.
Brill, A., Pomerleau, K., & Seiter, G. M. (2021). Estimating the Labor Supply Response to a Permanent Child Tax Credit Expansion. American Enterprise Institute.
[8] See, for example:
Burns, K., & Fox, L. E. (2022). The impact of the 2021 expanded child tax credit on child poverty. US Census Bureau, 22.
Macartney, S. E., Ghertner, R., Wheaton, L., & Giannarelli, L. (2022). Federal economic stimulus projected to cut poverty in 2021, though poverty may rise as benefits expire. Office of the Assistant Secretary for Planning and Evaluation, US Department of Health & Human Services.
Collyer, S., Curran, M. A., Garfinkel, I., Harris, D., Parolin, Z., Waldfogel, J., & Wimer, C. (2023). The Child Tax Credit and Family Well-Being: An Overview of Reforms and Impacts. The ANNALS of the American Academy of Political and Social Science, 706(1), 224-255. https://doi.org/10.1177/00027162231205148
Crandall-Hollick, M. L., Boyle, C. F., & Carter, J. A. (2021). The Child Tax Credit: The Impact of the American Rescue Plan Act (ARPA; PL 117-2) Expansion on Income and Poverty. Congressional Research Service.
[9] See Bastian (2024) for a discussion of the differences in the short-term versus long-term CTC impact estimates.
[10] Technically, Corinth (2021) constructs its own measure of child poverty that is scaled to reflect the share of children in poverty as measured by the SPM.
[11] See U.S. Census Bureau. (2023). SPM Thresholds by Metro Area: 2022 [Data set]. Retrieved from https://www2.census.gov/programs-surveys/demo/tables/p60/280/SPM-pov-threshold-2022.xlsx
[12] The child poverty rate using the official poverty measure was 15% in 2022. See Creamer, J., Shrider, E. A., Burns, K., & Chen, F. (2023). Income and poverty in the United States: 2022 (Report No. P60-280). US Census Bureau. https://www.census.gov/content/dam/Census/library/publications/2023/demo/p60-280.pdf
[13] Specifically, Bastian (2024) estimated that the reduction in child poverty from permanently expanding the ARP CTC relative to a pre-TCJA CTC is roughly 20% larger than that estimated relative to the TCJA CTC. That is, results were scaled by a factor of 1.2.
[14] Winship (2024) provides a detailed critique of the methodology and assumptions used in Bastian (2024), finding issue with Bastian’s elasticity assumption and the number of workers used. Specifically, Winship asserts that the elasticity Bastian used for the elasticity of low-income single mothers is too low and, therefore, understates the number of parents who would stop working under the CTC expansion and overstates the poverty reduction. In addition, Winship states that Bastian understates the number of workers because he relies solely on the ASEC, which has been shown to undercount low-income households. Winship concludes by stating that if these two issues are resolved, Bastian’s estimates would be much more in line with those of Corinth et. al. See Winship, S. (2024). Critiquing Bastian (2022, 2023, 2024, and forthcoming): On Child Tax Credit Reform and the Sensitivity of Single Mothers to Work Incentives. Working Paper. AEI Center on Opportunity and Social Mobility, American Enterprise Institute.
[15] See, for example:
Ananat, E., B. Glasner, C. Hamilton, and Z. Parolin, 2021. “Effects of the Expanded Child Tax Credit on Employment Outcomes: Evidence from Real-World Data.” Discussion Paper. Center on Poverty and Social Policy, Columbia University.
Hamilton, L., Roll, S., Despard, M., Maag, E., & Chun, Y. (2021). Employment, financial and well-being effects of the 2021 expanded child tax credit. Social Policy Institute. https://socialpolicyinstitute.wustl.edu/employment-financial-wellbeing-effects-2021-ctc-report/
Marr, C., Hingtgen, S., & Sherman, A. (2021). Earnings requirement would undermine child tax credits poverty-reducing impact while doing virtually nothing to boost parents’ employment. Center on Budget and Policy Priorities, Washington, DC.
Enriquez, B., Jones, D., & Tedeschi, E. V. (2023). The short-term labor supply response to the expanded child tax credit. Technical Report. National Bureau of Economic Research, Cambridge, MA.
[16] Specifically, the papers in the analysis reflect the change in labor supply due to the income and substitution effects arising from a change in the TCJA CTC to an ARP CTC. While the substitution effect is expected to be roughly the same between the change from the two baselines, the income effect is larger for the change from the ARP to pre-TCJA baseline due to the credit’s phase-in under the pre-TCJA credit. The labor supply effects in this analysis are scaled accordingly.
[17] Specifically, JCT estimates that the level of the aggregate labor supply would decline 0.2% over the first five years and 0.1% over the following 5 years. The average of the two estimates is used in this analysis.
[18] See Congressional Budget Office. (2024). An Update to the Budget and Economic Outlook: 2024 to 2034. June 2024 Update. Retrieved from https://www.cbo.gov/system/files/2024-06/60039-Outlook-2024.pdf.
[19] Total household resources are estimated to be AGI less federal and state taxes after credits.
[20] There is a large literature on how changes in household incomes for low-income children can impact childhood outcomes. The papers below provide a sample:
Aizer, A., Eli, S., Ferrie, J., & Lleras-Muney, A. (2016). The Long-Run impact of cash transfers to poor families. American Economic Review, 106(4), 935–971. https://doi.org/10.1257/aer.20140529
Bastian, J. and Michelmore, K., 2018. The long-term impact of the earned income tax credit on children’s education and employment outcomes. Journal of Labor Economics, 36(4), pp.1127-1163
Cooper, K., & Stewart, K. (2020). Does household income affect children’s outcomes? A systematic review of the evidence. Child Indicators Research, 14, 981–1005. https://doi.org/10.1007/s12187-020-09782-0
Dahl, G. B., & Lochner, L. (2012). The impact of family income on child achievement: Evidence from the earned income tax credit. American Economic Review, 102(5), 1927–1956. https://doi.org/10.1257/aer.102.5.1927
Duncan, G. J., Morris, P. A., & Rodrigues, C. (2011). Does money really matter? Estimating impacts of family income on young children’s achievement with data from random-assignment experiments. Developmental Psychology, 47(5), 1263–1279. https://doi.org/10.1037/a0023875
Hoynes, H., Schanzenbach, D. W., & Almond, D. (2016). Long-Run impacts of childhood access to the safety net. American Economic Review, 106(4), 903–934. https://doi.org/10.1257/aer.20130375
[21] See:
Goldin, J., Maag, E., & Michelmore, K. (2022). Estimating the net fiscal cost of a child tax credit expansion. Tax policy and the economy, 36(1), 159-195.
Bastian, J., & Michelmore, K. (2018). The long-term impact of the earned income tax credit on children’s education and employment outcomes. Journal of Labor Economics, 36(4), 1127-1163.
Werner, K. (2024). The Long-Term Impacts of Cash Assistance to Families. Urban Institute.
[22] Werner (2024) estimates the impact for households under 200% of the Federal Poverty Line (FPL). In 2021, the year in which the CTC was expanded, 200% of the FPL ranged from $25,760 for a single person to $89,320 for an eight-person household. 200% of the FPL was $53,000 for a family of four.
[23] To estimate the multiplier impact of the additional household income, the authors follow the method used in Garfinkel et al. (2022) which assumes children in households with incomes under $50,000 receive the full impact of the increase in income with effects phasing out after that point, reaching zero impact at incomes under $100,000. Garfinkel, I., Sariscsany, L., Ananat, E., Collyer, S., Hartley, R. P., Wang, B., & Wimer, C. (2022). The benefits and costs of a child allowance. Journal of Benefit-Cost Analysis, 13(3), 335-362.
[24] Earnings are defined as income from wages and salaries, self-employment, and farm income.
[25] The literature suggests that there could exist increasing or decreasing marginal returns to each additional dollar of household income as earnings increase. For example, Werner (2024) assume this impact phases out linearly. The paper cites others, such as Duncan, Morris, and Rodrigues (2011), which find that large increases in family income could generate proportionally larger impacts on children, as well as the opposite possibility that the returns to each additional dollar decreases as incomes increase.
[26] There exists a body of research that explores how a child’s income is impacted by that of their parents. See, for example: Chetty, R., Hendren, N., Kline, P., Saez, E., & Turner, N. (2014). Is the United States still a land of opportunity? Recent trends in intergenerational mobility. American Economic Review, 104(5), 141–147. https://doi.org/10.1257/aer.104.5.141.
[27] For example, consider a child with two working parents earning $26,000 and $12,000 ($38,000 total) and receiving a CTC of $3,000, which is $2,000 greater than the $1,000 credit received under the pre-TCJA policy. The family’s total baseline income is $39,000 before the policy change and $41,000 after the policy change, reflecting an income increase equivalent to the CTC increase. If, instead, the parent earning $12,000 leaves the labor force, income after the policy change would be $29,000 (=$26,000 + $3,000), reflecting an income loss of $10,000. As an adult, the child would earn $19,000 (= ($26,000 + $12,000) / 2) if both parents stay in the labor force. If, instead, the parent earning $12,000 leaves the labor force, the child’s baseline earnings would be $13,000 (=$26,000 / 2).
[28] This adjustment reflects the fact that resources are shared within households and is commonly used in policy estimates. For example, a concept known as an equivalence adjustment for income is used by CBO and Census. CBO uses the following generalized formula for calculating the equivalence scale: ES= ne where n is the number of people in the household and e is an elasticity parameter between 0 and 1. CBO assumes e = .5, implying that each additional person increases household needs at a decreasing rate. See: US Census Bureau (2021). Equivalence Adjustment of Income. United States Census Bureau. and Congressional Budget Office (2023). The Distribution of Household Income in 2020.
[29] This assumption follows that made in the literature regarding the phase out of benefits. For instance, Goldin, Maag, and Michelmore (2022) assume children in households under $50,000 receive the full multiplier impact, children in households with incomes from $50,000 to $100,000 receive half the multiplier impact, and that there is no earnings impact for families with incomes over $100,000. This follows Garfinkel, I., Sariscsany, L., Ananat, E., Collyer, S., & Wimer, C. (2021). The costs and benefits of a child allowance. Center on Poverty and Social Policy, February, 18. Bastian (2024) estimates the CTC expansion’s effects on child poverty for households with AGI under $80,000, following the findings of Feldman, N. E., Katuščák, P., & Kawano, L. (2016). Taxpayer confusion: Evidence from the child tax credit. American Economic Review, 106(3), 807-835. Werner (2024) assumes the impacts per additional dollar of income phase out linearly.
[30] The terms resources, household income, and earnings are used throughout this report. The total resources of a tax unit are calculated as AGI less federal and state taxes after credits and reflects all funds available to the household. Household income in this report reflects the earnings of parents plus the CTC. Earnings reflects the sum of wage and salary income, self-employment income, and farm income. Total resources are used to classify households into groups to determine the elasticities that apply to the household. The elasticities are then applied to earnings.
[31] For example, see: Shinichi Nishiyama, “Fiscal Policy Effects in a Heterogeneous-Agent Overlapping-Generations Economy With an Aging Population,” Congressional Budget Office, Working Paper 2013-07, December 2013; Joint Committee on Taxation (JCT), Macroeconomic Analysis of the ‘Tax Reform Act of 2014,’ February 2014 (JCX-22-14); JCT, Macroeconomic Analysis of Various Proposals to Provide $500 Billion in Tax Relief, March 2005 (JCX-4-05); and, US Department of the Treasury, The President’s Advisory Panel on Federal Tax Reform, Simple, Fair, & Pro-Growth: Proposals to Fix America’s Tax System, November 2005.
[32] David Altig, Alan Auerbach, Laurence Koltikoff, Kent Smetters, and Jan Walliser, “Simulating Fundamental Tax Reform in the United States,” American Economic Review, 91(3) (2001): 574-595.
[33] Jane Gravelle and Kent Smetters, “Does the Open Economy Assumption Really Mean That Labor Bears the Burden of a Capital Income Tax?” Advances in Economic Analysis and Policy, 6(1) (2006): 1-42.
[34] While “long run” typically refers to the new steady state after the economy has adjusted to the policy this analysis deviates from that definition. This is because, for example, the CTC is not indexed for inflation and, therefore, decreases in real value over time. Additionally, current children that will have higher adult earnings due to receiving a higher CTC could also receive the expanded CTC as adults and their children would have the combined benefit of a parent with higher earnings and an expanded CTC. Accordingly, the long-run estimates display results for when all working adults received the expanded CTC for their entire childhood if the tax return of their parent(s) was eligible.
[35] Assuming the current-policy baseline instead of the current-law baseline, for example, would result in both more positive and more negative macroeconomic impacts relative to those presented in this analysis. The budget-neutral increase in the corporate income tax rate needed to fund the expansion would be lower resulting in a less negative macroeconomic impact. However, the positive macroeconomic impact via the change in adult earnings would be less pronounced resulting in a more negative macroeconomic impact. Additionally, the estimated reduction in parents working due to a permanently expanded CTC would be broadly similar to those presented in this analysis. This is because the substitution effect is expected to be roughly the same for these two baselines due to it primarily resulting from the change to the ACTC phase-in from the ARP CTC; the impact resulting from the income effect, however, would be lessened.